

Question: Create a line chart for the closing prices for all years and a stock chart for the high/low/close prices for 2011 through 2012 in the
Create a line chart for the closing prices for all years and a stock chart for the high/low/close prices for 2011 through 2012 in the accompanying S&P 500 data.
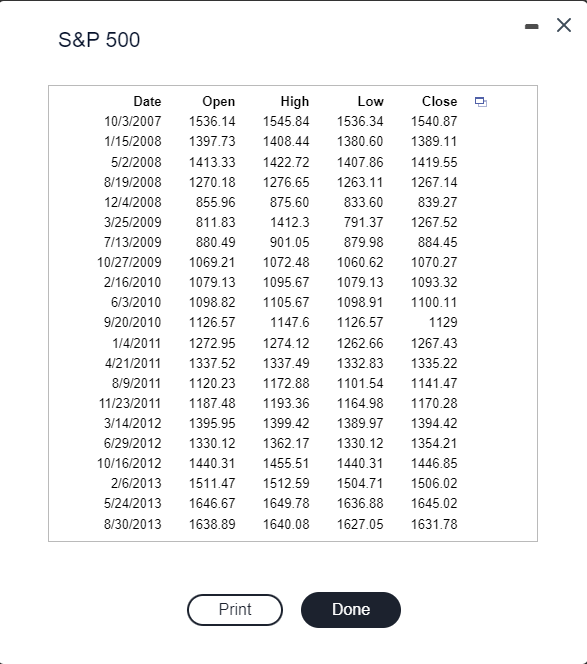
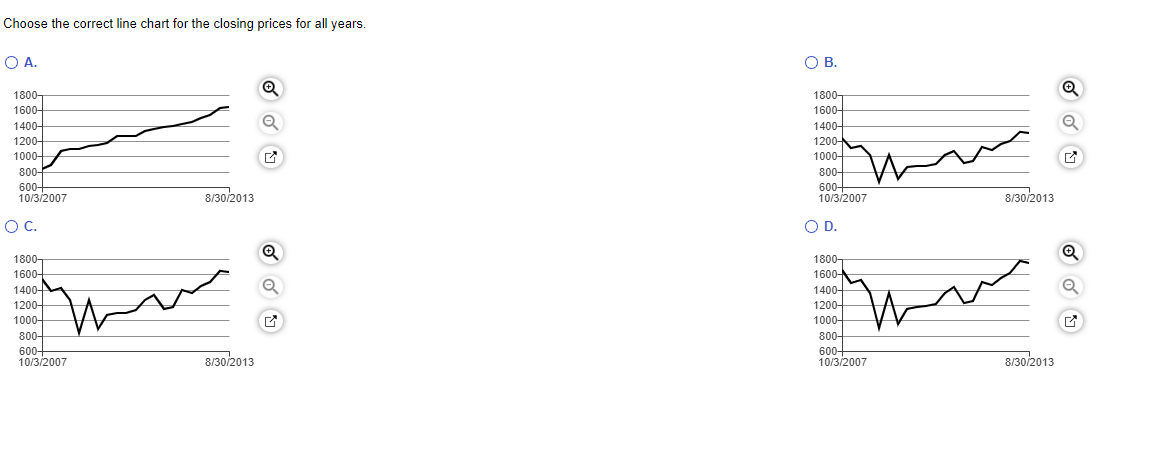
S&P500 Choose the correct line chart for the closing prices for all years. A
Step by Step Solution
There are 3 Steps involved in it
1 Expert Approved Answer
Step: 1 Unlock

Question Has Been Solved by an Expert!
Get step-by-step solutions from verified subject matter experts
Step: 2 Unlock
Step: 3 Unlock