

Question: Create a line chart for the closing prices for all years and a stock chart for the highiowiclose prices for 2011 through 2012 in the
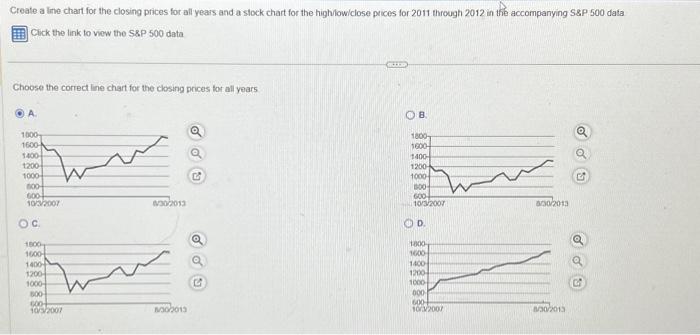
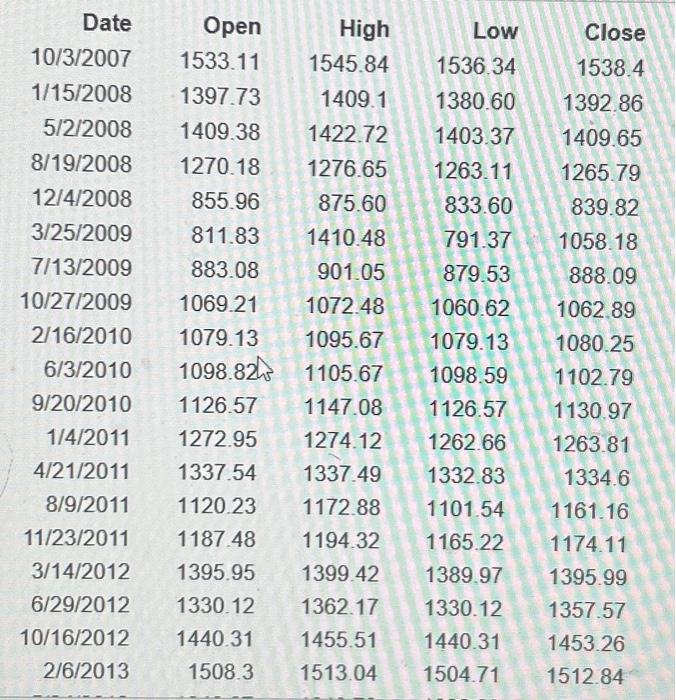
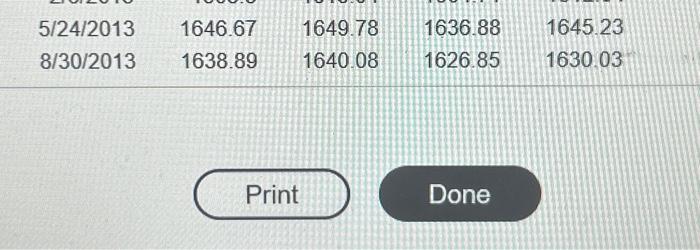
Create a line chart for the closing prices for all years and a stock chart for the highiowiclose prices for 2011 through 2012 in the accompanying S\&P 500 data Cick the link to view the SBP 500 data Choose the correct line chart for the closing prices tor all years Date10/3/20071/15/20085/2/20088/19/200812/4/20083/25/20097/13/200910/27/20092/16/20106/3/20109/20/20101/4/20114/21/20118/9/201111/23/20113/14/20126/29/201210/16/20122/6/2013Open1533.111397.731409.381270.18855.96811.83883.081069.211079.131098.821126.571272.951337.541120.231187.481395.951330.121440.311508.3High1545.841409.11422.721276.65875.601410.48901.051072.481095.671105.671147.081274.121337.491172.881194.321399.421362.171455.511513.04Low1536.341380.601403.371263.11833.60791.37879.531060.621079.131098.591126.571262.661332.831101.541165.221389.971330.121440.311504.71Close1538.41392.861409.651265.79839.821058.18888.091062.891080.251102.791130.971263.811334.61161.161174.111395.991357.571453.261512.84 5/24/20138/30/20131646.671638.891649.781640.081636.881626.851645.231630.03 Print Done
Step by Step Solution
There are 3 Steps involved in it

Get step-by-step solutions from verified subject matter experts