

Question: Create a MATLAB script that generates a scatter plot for the given data points and labels the axes appropriately. x = [ 1 , 2
Create a MATLAB script that generates a scatter plot for the given data points and labels the axes appropriately.
x
y
The data points are provided in the vectors x and y Ensure that the plot has a title and the axes are labeled.
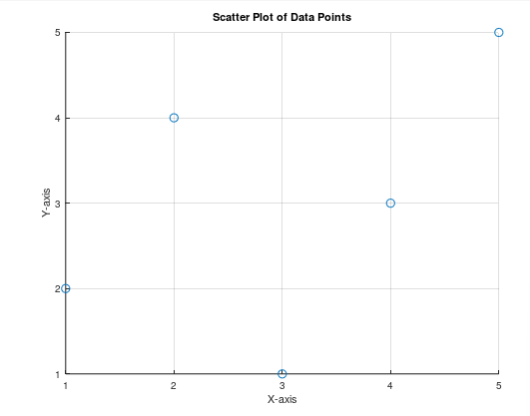
Y-axis 20 4 5 Scatter Plot of Data Points 1 1 2 3 5 X-axis
Step by Step Solution
There are 3 Steps involved in it
1 Expert Approved Answer
Step: 1 Unlock

Question Has Been Solved by an Expert!
Get step-by-step solutions from verified subject matter experts
Step: 2 Unlock
Step: 3 Unlock