

Question: Create a P Chart using the following sample data. What is the upper control limit, center line and lower control limit? Are any samples out
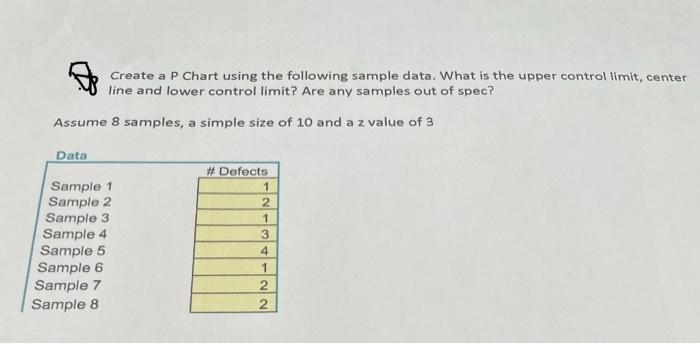
Create a P Chart using the following sample data. What is the upper control limit, center line and lower control limit? Are any samples out of spec? Assume 8 samples, a simple size of 10 and a z value of 3
Step by Step Solution
There are 3 Steps involved in it
1 Expert Approved Answer
Step: 1 Unlock

Question Has Been Solved by an Expert!
Get step-by-step solutions from verified subject matter experts
Step: 2 Unlock
Step: 3 Unlock