

Question: Create a P Chart!!!! using the following sample data. What is the upper control limit , center line and lower control limit ? Are any
Create a P Chart!!!! using the following sample data. What is the upper control limit center
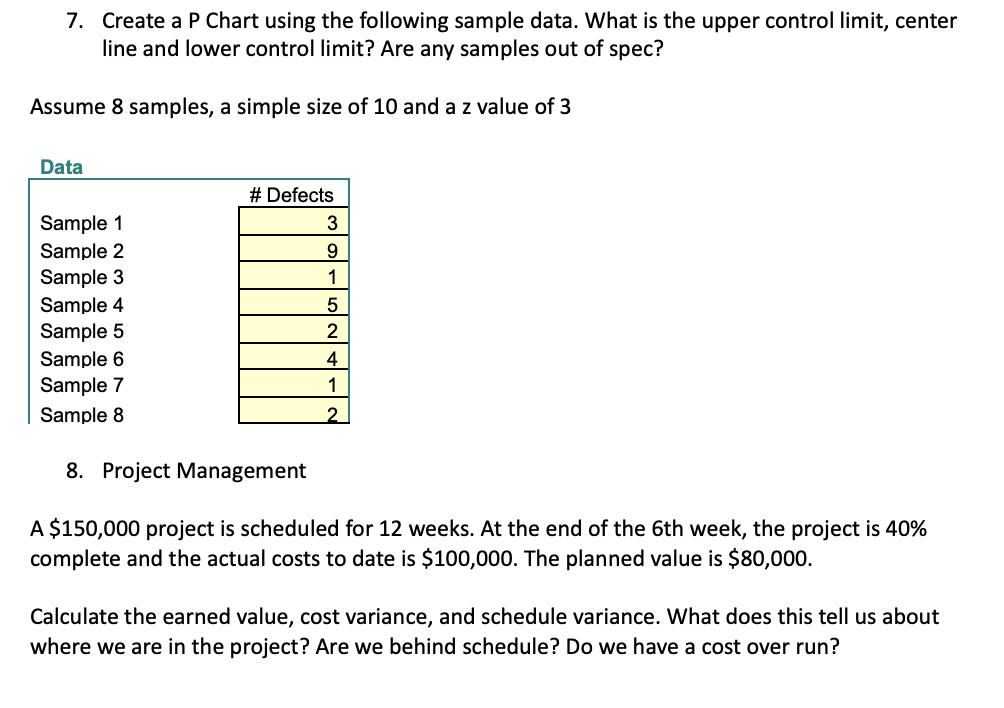
line and lower control limit Are any samples out of spec?
Assume samples, a simple size of and a value of
Data
Project Management
A $ project is scheduled for weeks. At the end of the th week, the project is
complete and the actual costs to date is $ The planned value is $
Calculate the earned value, cost variance, and schedule variance. What does this tell us about
where we are in the project? Are we behind schedule? Do we have a cost over run?
Step by Step Solution
There are 3 Steps involved in it
1 Expert Approved Answer
Step: 1 Unlock

Question Has Been Solved by an Expert!
Get step-by-step solutions from verified subject matter experts
Step: 2 Unlock
Step: 3 Unlock