

Question: Create a scatterplot with the equation and R and explain it addressing p-values for coefficient and intercept. TABLE 5-3 Calculations to Estimate Regression Line for
Create a scatterplot with the equation and R² and explain it addressing p-values for coefficient and intercept.
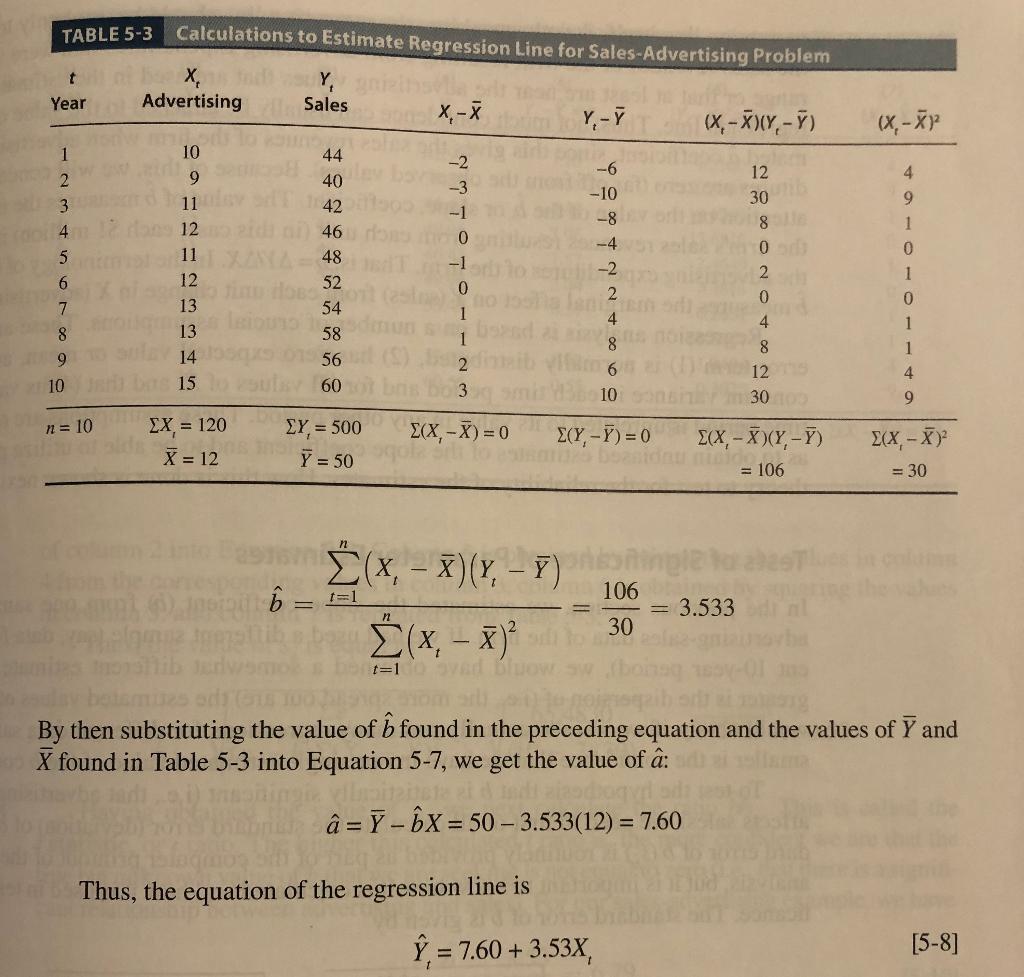
TABLE 5-3 Calculations to Estimate Regression Line for Sales-Advertising Problem t be X, tOAdvertising Y, nizihse: ll Sales Year X,-X (x,-Xp 10 44 -2 -6 12 4 40 -3 -10 30 9. 11 42 -1 -8 8 le 12 46 -4 11 48 -2 1 12 o tin iloeo 13 6. 52 0. 54 4 1 8 13 58 1 8 1 9. 14 56 12 4 10 15 60 3 10 30 0 9. EX = 120 X = 12 -500 Y = 50 n= 10 (X,-X) = 0 E(Y-F) = 0 o a boantdnu tO 106 E(X- X)(Y-Y) E(X, X) = 30 esom (x, X)(Y, Y) n 106 = 3.533 E(x, x)' 30 t=1 vad By then substituting the value of b found in the preceding equation and the values of Y and X found in Table 5-3 into Equation 5-7, we get the value of : = Y-6X = 50- 3.533(12) = 7.60 Thus, the equation of the regression line is = 7.60 + 3.53X, [5-8]
Step by Step Solution
3.47 Rating (163 Votes )
There are 3 Steps involved in it
For running the excel regression model follow below steps Enter the data Go To Dat... View full answer

Get step-by-step solutions from verified subject matter experts