

Question: Create a script that projects population based on static Annual Migration ( Mann ) & variable Birth Rates ( BR ) and Death Rates (
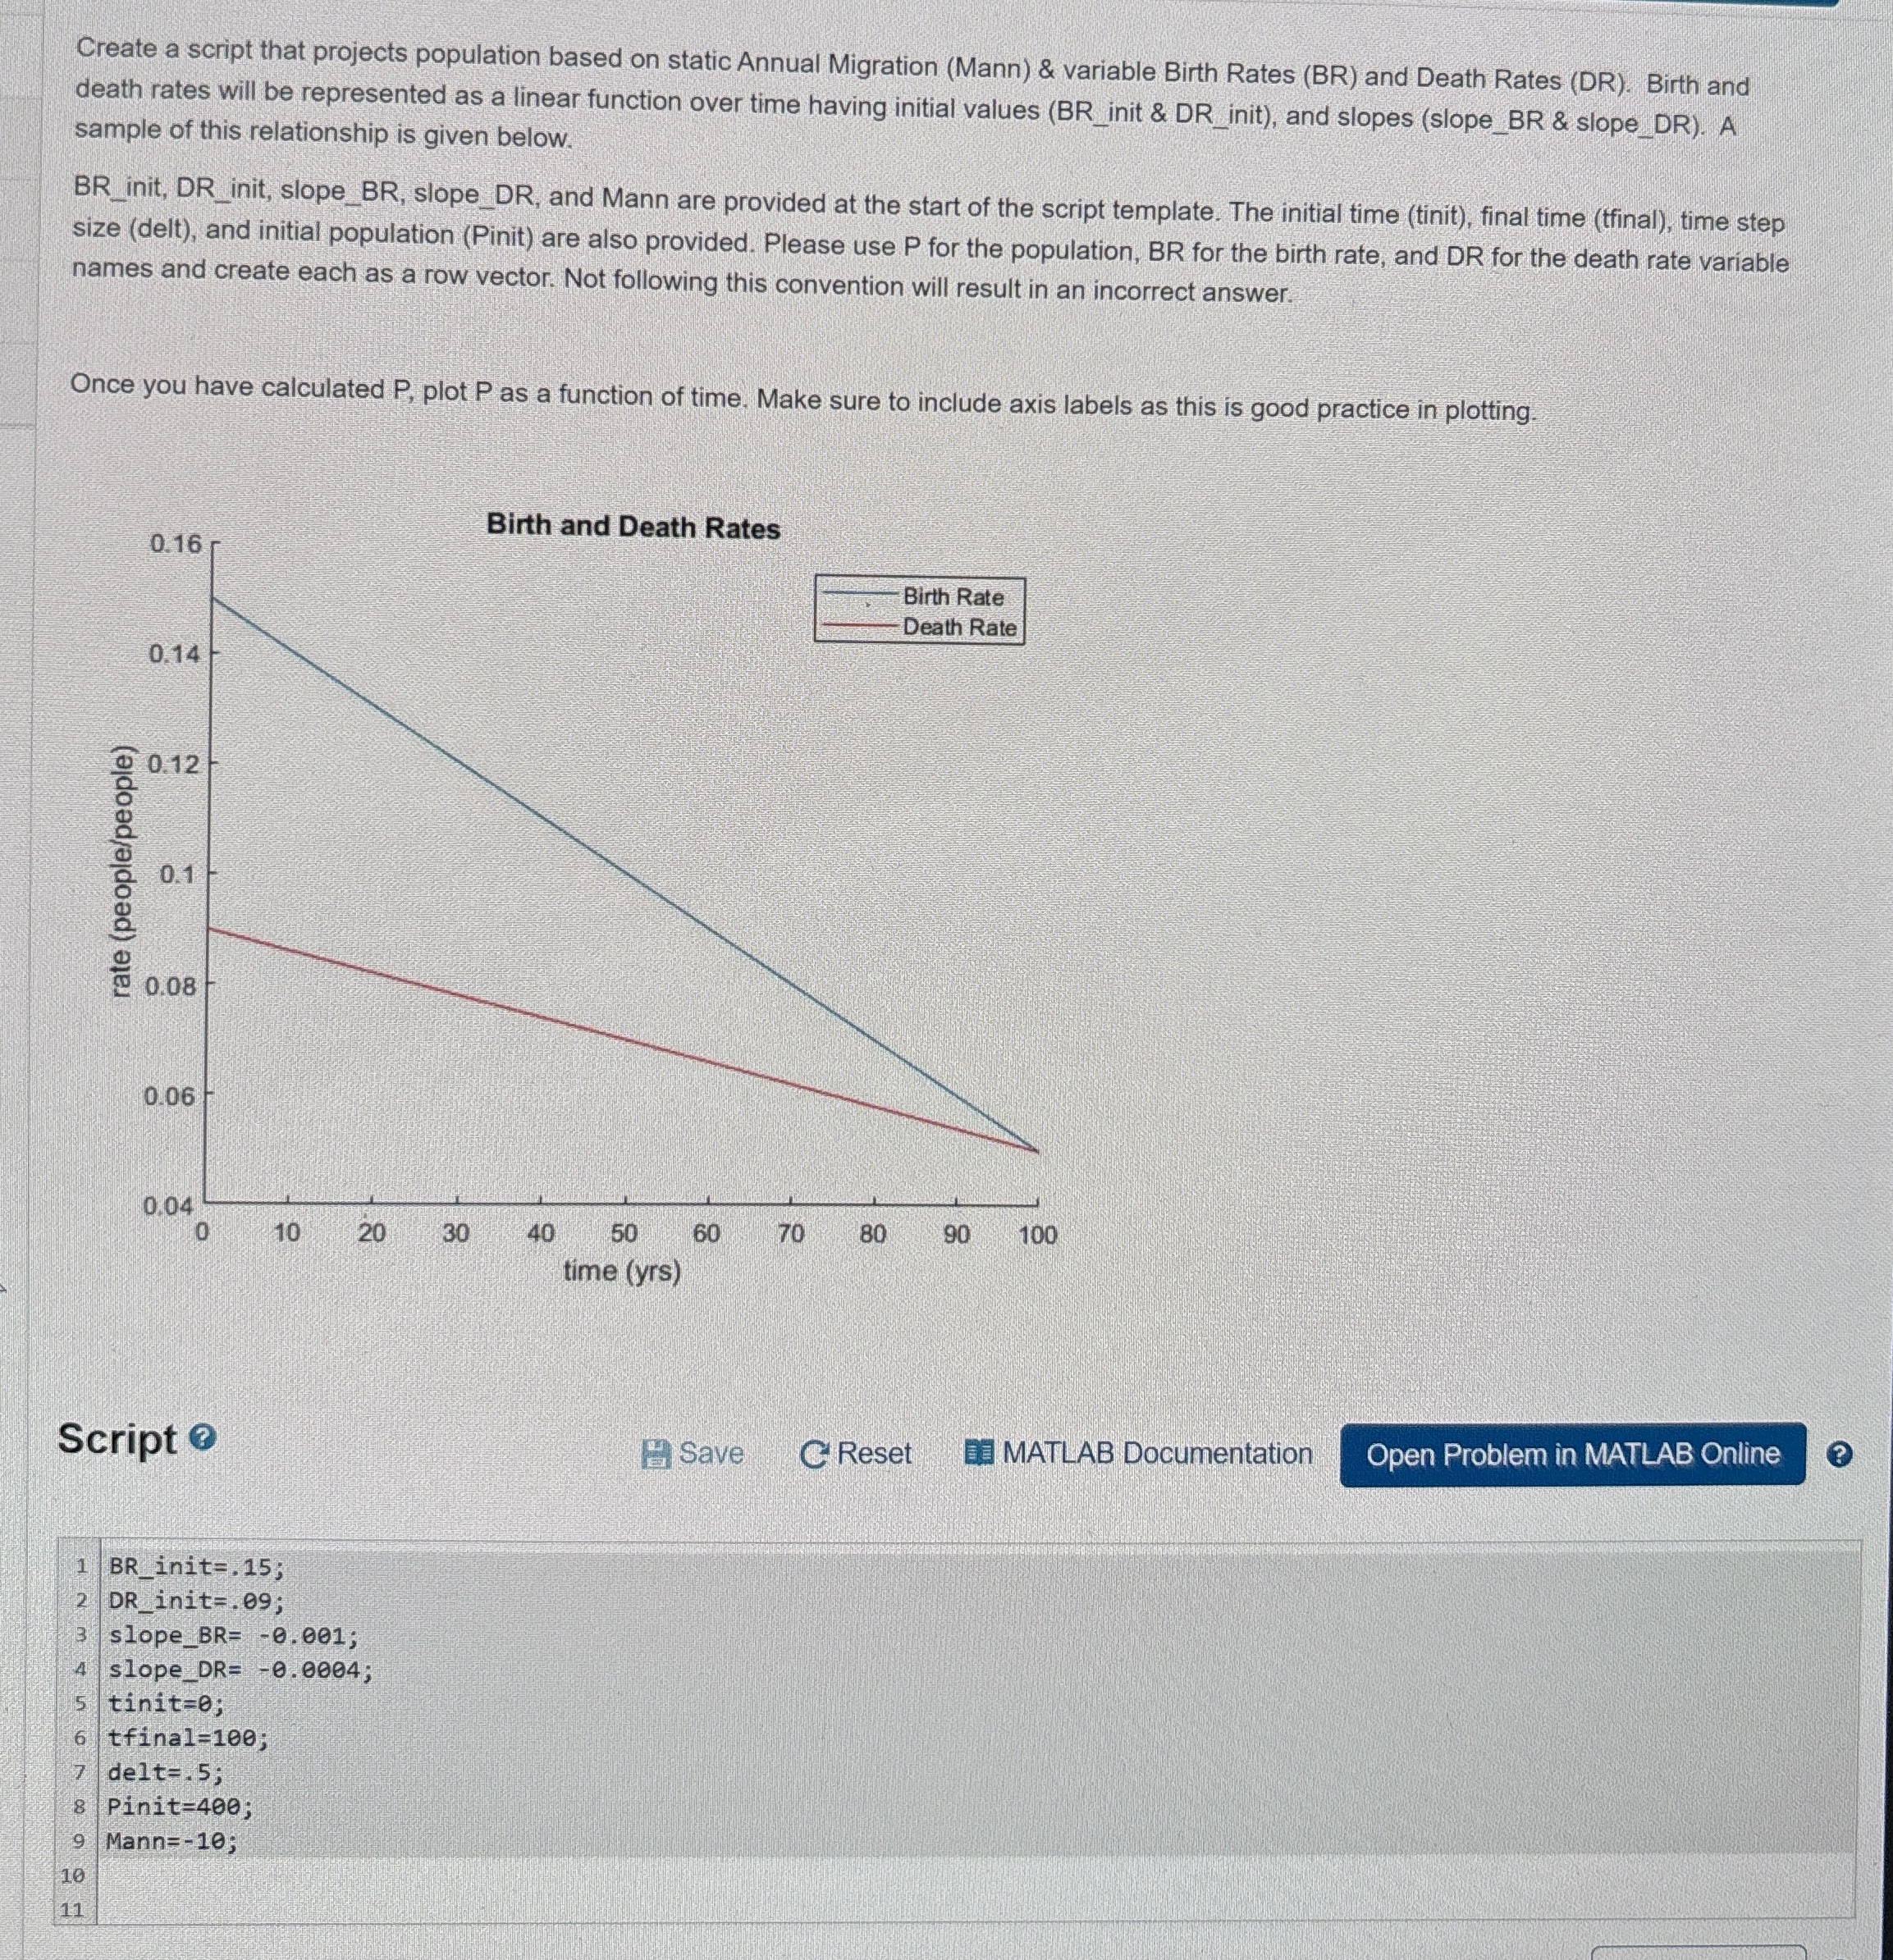
Create a script that projects population based on static Annual Migration Mann & variable Birth Rates BR and Death Rates DR Birth and death rates will be represented as a linear function over time having initial values BRinit & DRinit and slopes slopeBR & slopeDR A sample of this relationship is given below.
BRinit, DRinit, slopeBR slopeDR and Mann are provided at the start of the script template. The initial time tinit final time tfinal time step size delt and initial population Pinit are also provided. Please use for the population, BR for the birth rate, and DR for the death rate variable names and create each as a row vector. Not following this convention will result in an incorrect answer.
Once you have calculated plot as a function of time. Make sure to include axis labels as this is good practice in plotting.
Birth and Death Rates
Script
Save
Reset
MATLAB DocumentationAssessment:
Population is correct
Birth rate is correct
Death rate is correct
Population plot is formatted correctly
Create a script that projects population based on static Annual Migration Mann & variable Birth Rates BR and Death Rates DR Birth and death rates will be represented as a linear function over time having initial values BR init & DR init and slopes slopeBR & slopeDR A sample of this relationship is given below.
init, init, slopeBR slopeDR and Mann are provided at the start of the script template. The initial time tinit final time tinal time step size delt and initial population Pinit are also provided. Please use P for the population, BR for the birth rate, and DR for the death rate variable names and create each as a row vector. Not following this convention will result in an incorrect answer.
Once you have calculated plot as a function of time. Make sure to include axis labels as this is good practice in plotting.
Script
Save
C Reset
MATLAB Documentation
Step by Step Solution
There are 3 Steps involved in it
1 Expert Approved Answer
Step: 1 Unlock

Question Has Been Solved by an Expert!
Get step-by-step solutions from verified subject matter experts
Step: 2 Unlock
Step: 3 Unlock