

Question: In Matlab's Language: create a function that projects population based on static: Annual Migration(Mann) & variable Birth Rate (BR) and Death Rate (DR). Birth and
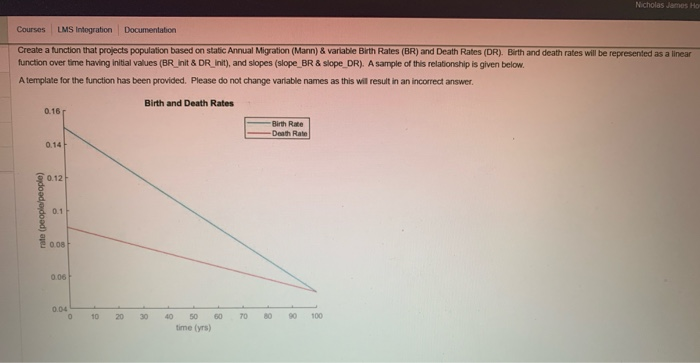
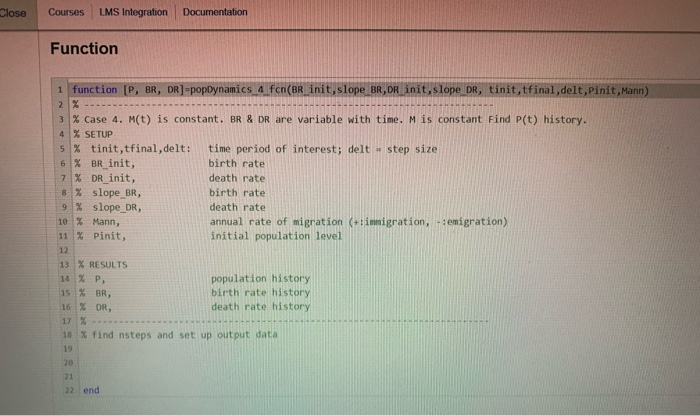
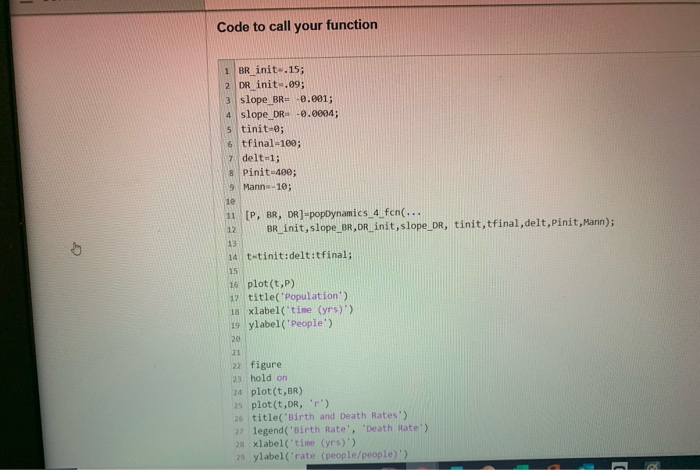
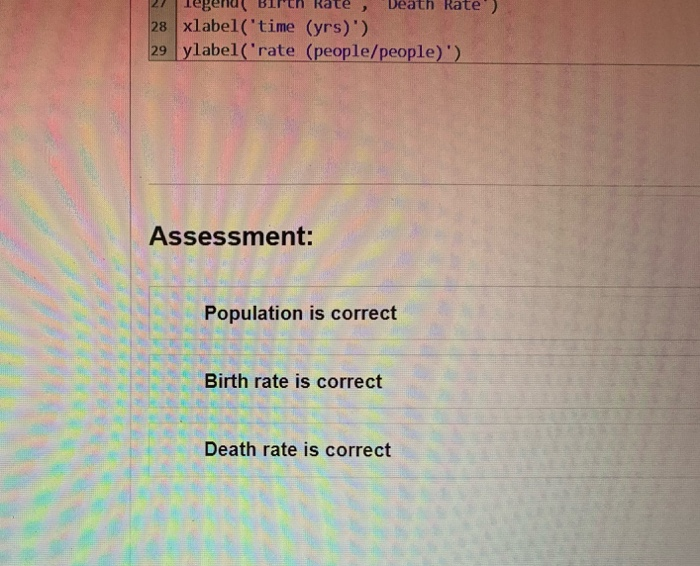
Nicholas James Courses LMS Integration Documentation Create a function that projects population based on static Annual Migration (Mann) & variable Birth Rates (BR) and Death Rates (DR). Birth and death rates will be represented as a linear function over time having initial values (BR_ht & DR Int), and slopes (slope BR & slope DR). A sample of this relationship is given below. A template for the function has been provided. Please do not change variable names as this will result in an incorrect answer Birth and Death Rates -Birth Rate -Death Rate rate (people, people) 08 006 004 0 10 20 30 40 50 60 time yrs) 70 80 90 Close Courses LMS Integration Documentation Function 1 function (P, BR, DR]=popDynamics 4. fcn(BR init, slope BR, DR init, slope DR, tinit,tfinal,delt, Pinit, Mann) % Case 4. (t) is constant. BR & DR are variable with time. M is constant Find P(t) history. 4 X SETUP 5 % tinit,tfinal,delt: time period of interest; delt - step size 6 % BR_init, birth rate 7 % DR init, death rate 8 % slope BR birth rate 9 % slope_DR, death rate 10 % Mann, annual rate of migration (+: immigration, emigration) 11 % Pinit, initial population level 13 % RESULTS 14 % P. population history 15 % BR. birth rate history 16 % DR, death rate history 17 % 18 % find nsteps and set up output data 22 end Code to call your function 1 BR_init-.15; 2 DR init-.09; 3 slope BR= -0.001; 4 slope DRE -0.0004; tinit-e; tfinal-100; 7 delt 1; 8 Pinit 400; 9 Manne-10; 11 [P, BR, DR)popDynamics_4 fon(... BR init, slope BR,DR_init, slope_DR, tinit,tfinal, delt,Pinit, Mann); 14 t-tinit:delt:tfinal; 16 plot(t,P) 17 title('Population) 18 xlabel('time (yrs)) 19 ylabel('People') 22 figure 23 hold on 24 plot(t,BR) 25 plot(t,DR, 'r') 26 title('Birth and Death Rates) 27 legend('Birth rate', 'Death Rate') 28 xlabel('time (yrs) ) 29ylabel('rate (people/people)) segera( brun Kale, Death Rate 28 xlabel('time (yrs)') 29 ylabel('rate (people/people)') Assessment: Population is correct Birth rate is correct Death rate is correct
Step by Step Solution
There are 3 Steps involved in it

Get step-by-step solutions from verified subject matter experts