

Question: Create a SPSS data set using the following information from a sample of US states. Include screen shots of the data view, variable view and
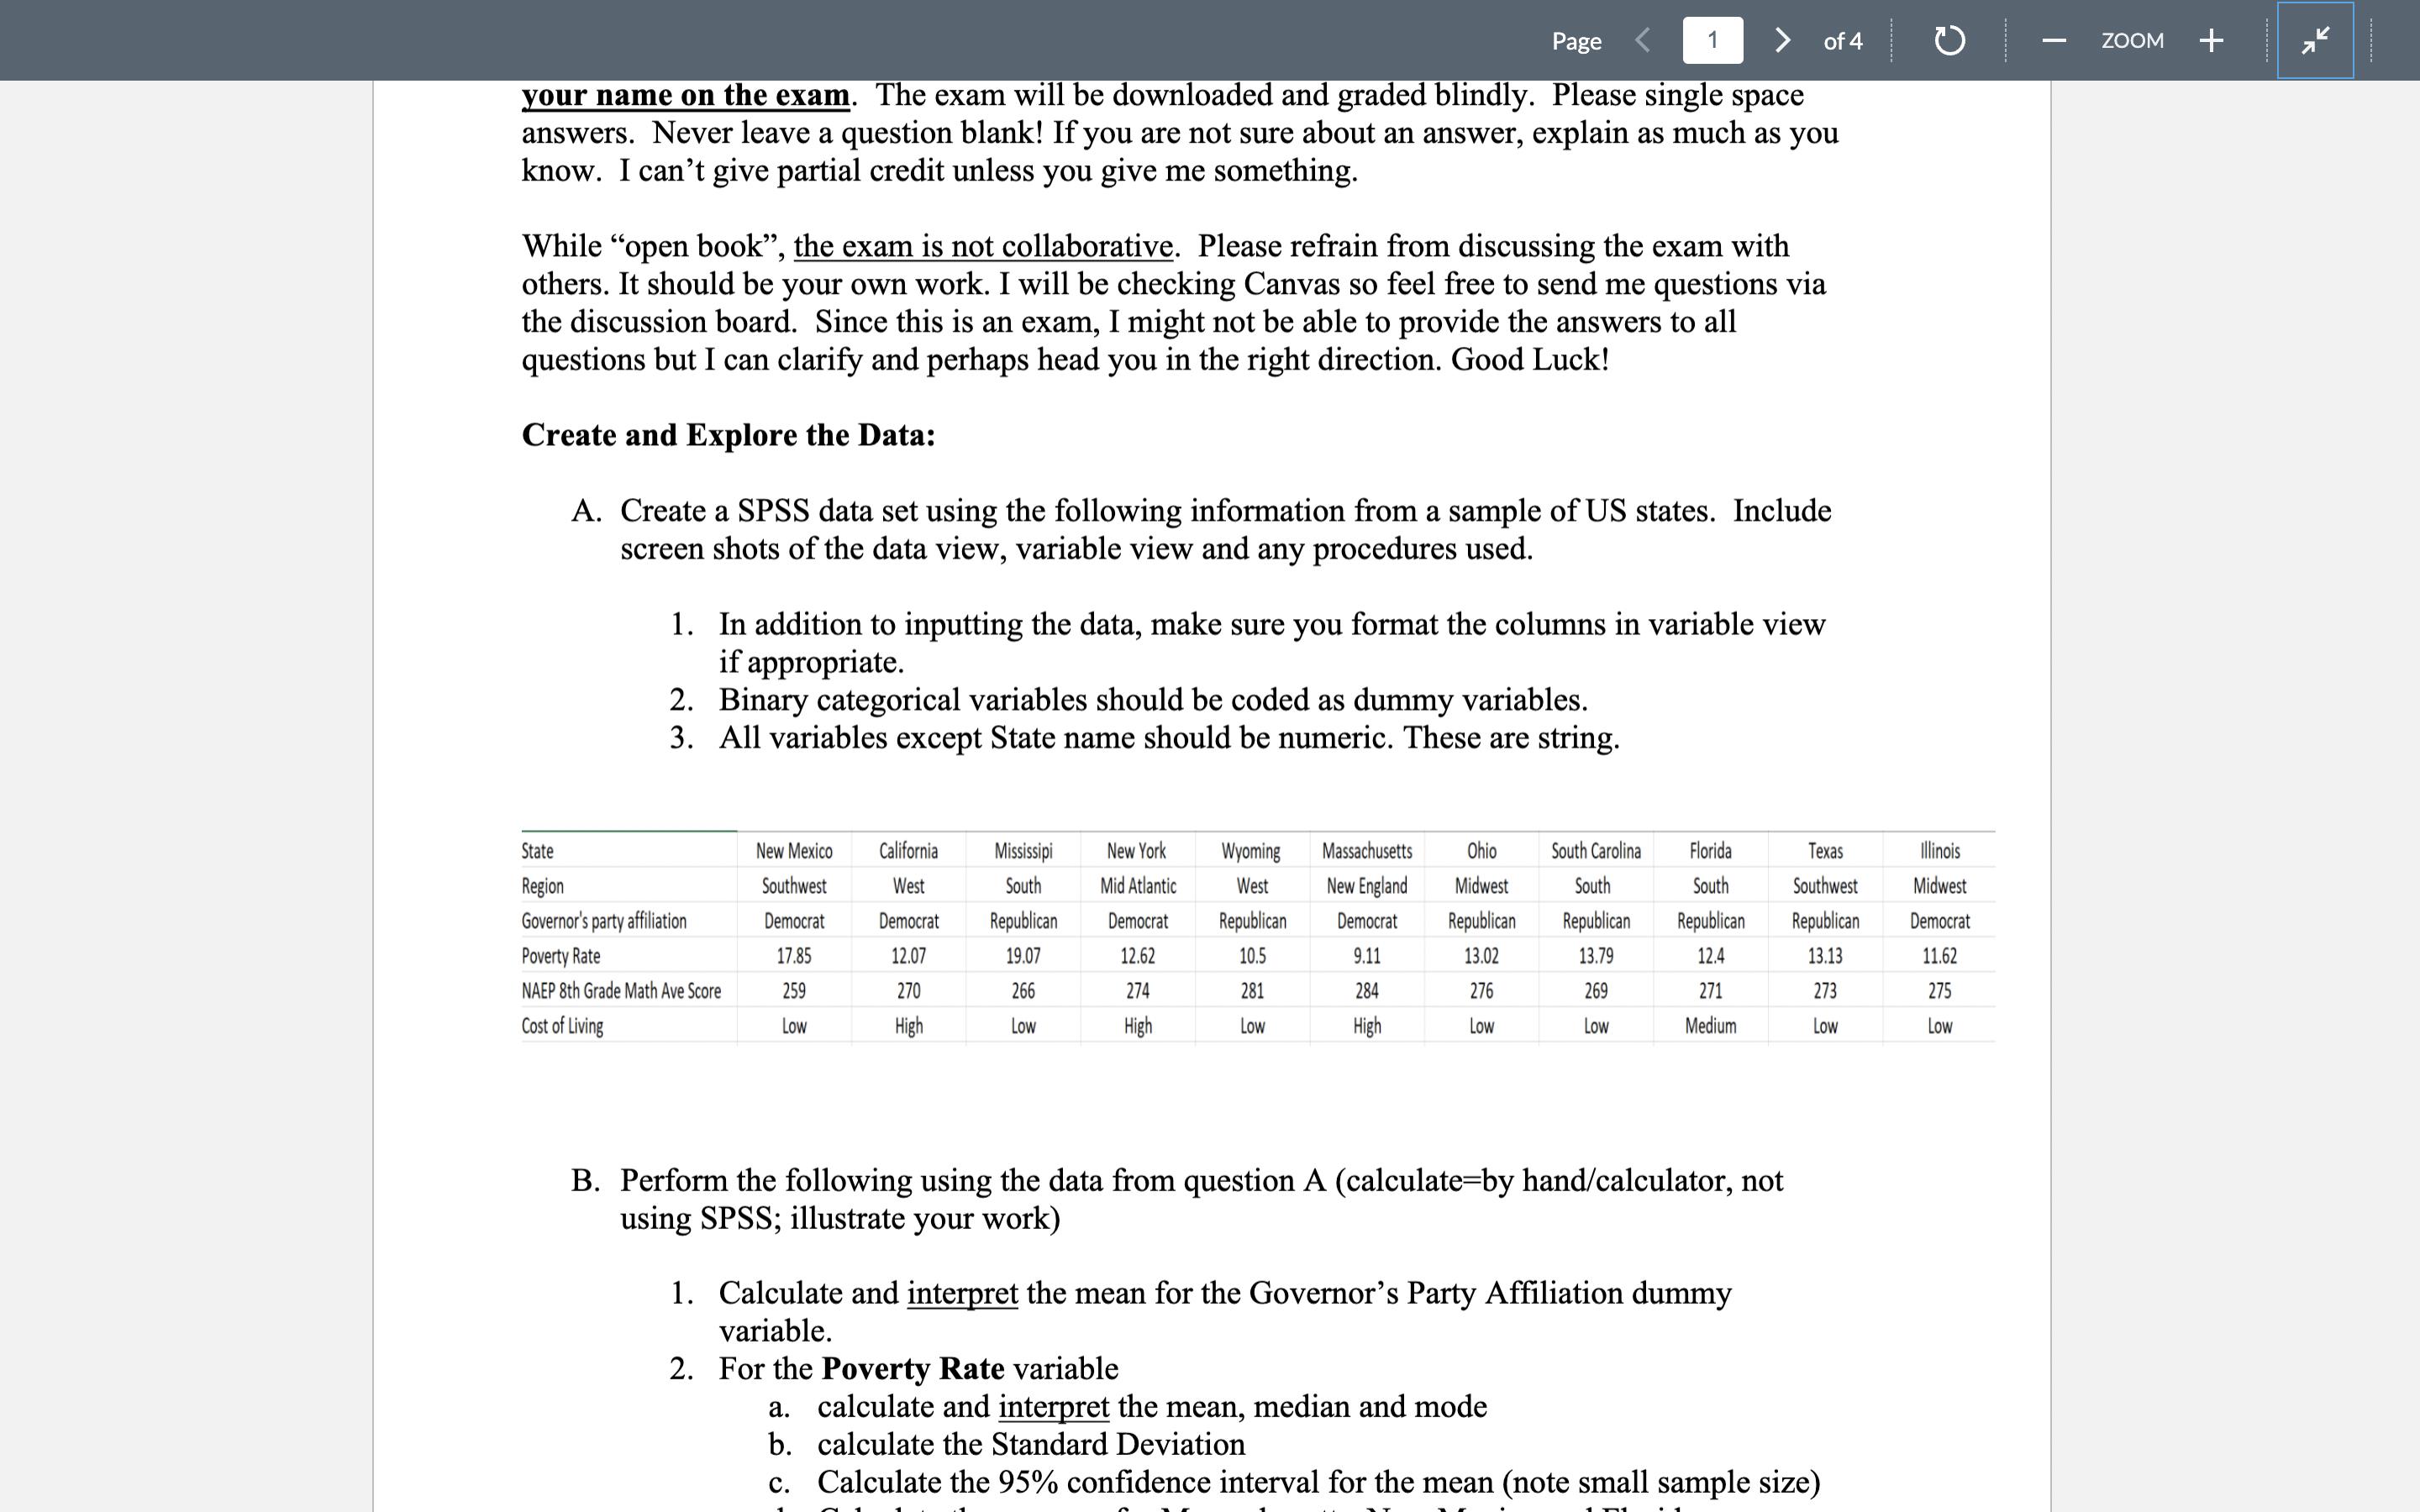
Create a SPSS data set using the following information from a sample of US states. Include
screen shots of the data view, variable view and any procedures used.
1. In addition to inputting the data, make sure you format the columns in variable view
if appropriate.
2. Binary categorical variables should be coded as dummy variables.
3. All variables except State name should be numeric. These are string.
B. Perform the following using the data from question A (calculate=by hand/calculator, not
using SPSS; illustrate your work)
1. Calculate and interpret the mean for the Governor's Party Affiliation dummy
variable.
2. For the Poverty Rate variable
a. calculate and interpret the mean, median and mode
b. calculate the Standard Deviation
c. Calculate the 95% confidence interval for the mean (note small sample size)
d. Calculate the z-scores for Massachusetts, New Mexico and Florida.
e. Assume that the poverty rate comes from a standard normal distribution.
Using the z-scores from d and the standard normal table to answer the
following questions.
i. What is the probability that a state would have a poverty rate as high
or higher than Florida?
ii. What is the probability that a state would score in-between New
Mexico and Massachusetts?
3. Now check your calculations for poverty rate the you calculated above by having
SPSS provide you with
a. the mean
b. standard deviations
c. 95% confidence interval
d. z-scores
Copy and paste any SPSS table as part of your answer and explain how you produced
the results in SPSS. Do they match?
Please type out your answers and cut and paste graphs, charts, pictures of written work etc into this
document under the appropriate question. Upload completed exam and altered dataset. Do not type
your name on the exam. The exam will be downloaded and graded blindly. Please single space
answers. Never leave a question blank! If you are not sure about an answer, explain as much as you
know. I can't give partial credit unless you give me something.
While "open book", the exam is not collaborative. Please refrain from discussing the exam with
others. It should be your own work. I will be checking Canvas so feel free to send me questions via
the discussion board. Since this is an exam, I might not be able to provide the answers to all
questions but I can clarify and perhaps head you in the right direction. Good Luck!
Create and Explore the Data:
Page > of 4 your name on the exam. The exam will be downloaded and graded blindly. Please single space answers. Never leave a question blank! If you are not sure about an answer, explain as much as you know. I can't give partial credit unless you give me something. While "open book", the exam is not collaborative. Please refrain from discussing the exam with others. It should be your own work. I will be checking Canvas so feel free to send me questions via the discussion board. Since this is an exam, I might not be able to provide the answers to all questions but I can clarify and perhaps head you in the right direction. Good Luck! Create and Explore the Data: A. Create a SPSS data set using the following information from a sample of US states. Include screen shots of the data view, variable view and any procedures used. 1. In addition to inputting the data, make sure you format the columns in variable view if appropriate. 2. 3. Binary categorical variables should be coded as dummy variables. All variables except State name should be numeric. These are string. State Region Governor's party affiliation Poverty Rate NAEP 8th Grade Math Ave Score Cost of Living New Mexico Southwest Democrat 17.85 259 Low California Mississipi West South Democrat Republican 19.07 12.07 270 266 High Low New York Mid Atlantic Democrat 12.62 274 High 1 Wyoming West Republican 10.5 281 Low Massachusetts New England Democrat 9.11 284 High 2. For the Poverty Rate variable Ohio South Carolina Florida Midwest South South Republican Republican Republican 13.02 13.79 12.4 276 269 271 Low Low Medium B. Perform the following using the data from question A (calculate-by hand/calculator, not using SPSS; illustrate your work) 1. Calculate and interpret the mean for the Governor's Party Affiliation dummy variable. Texas Southwest Republican 13.13 273 Low a. calculate and interpret the mean, median and mode b. calculate the Standard Deviation C. Calculate the 95% confidence interval for the mean (note small sample size) Illinois Midwest Democrat 11.62 275 Low ZOOM +
Step by Step Solution
There are 3 Steps involved in it

Get step-by-step solutions from verified subject matter experts