

Question: Create a variable y that calculates the following function for the range of t . The variable, t , should contain 4 5 0 data
Create a variable that calculates the following function for the range of
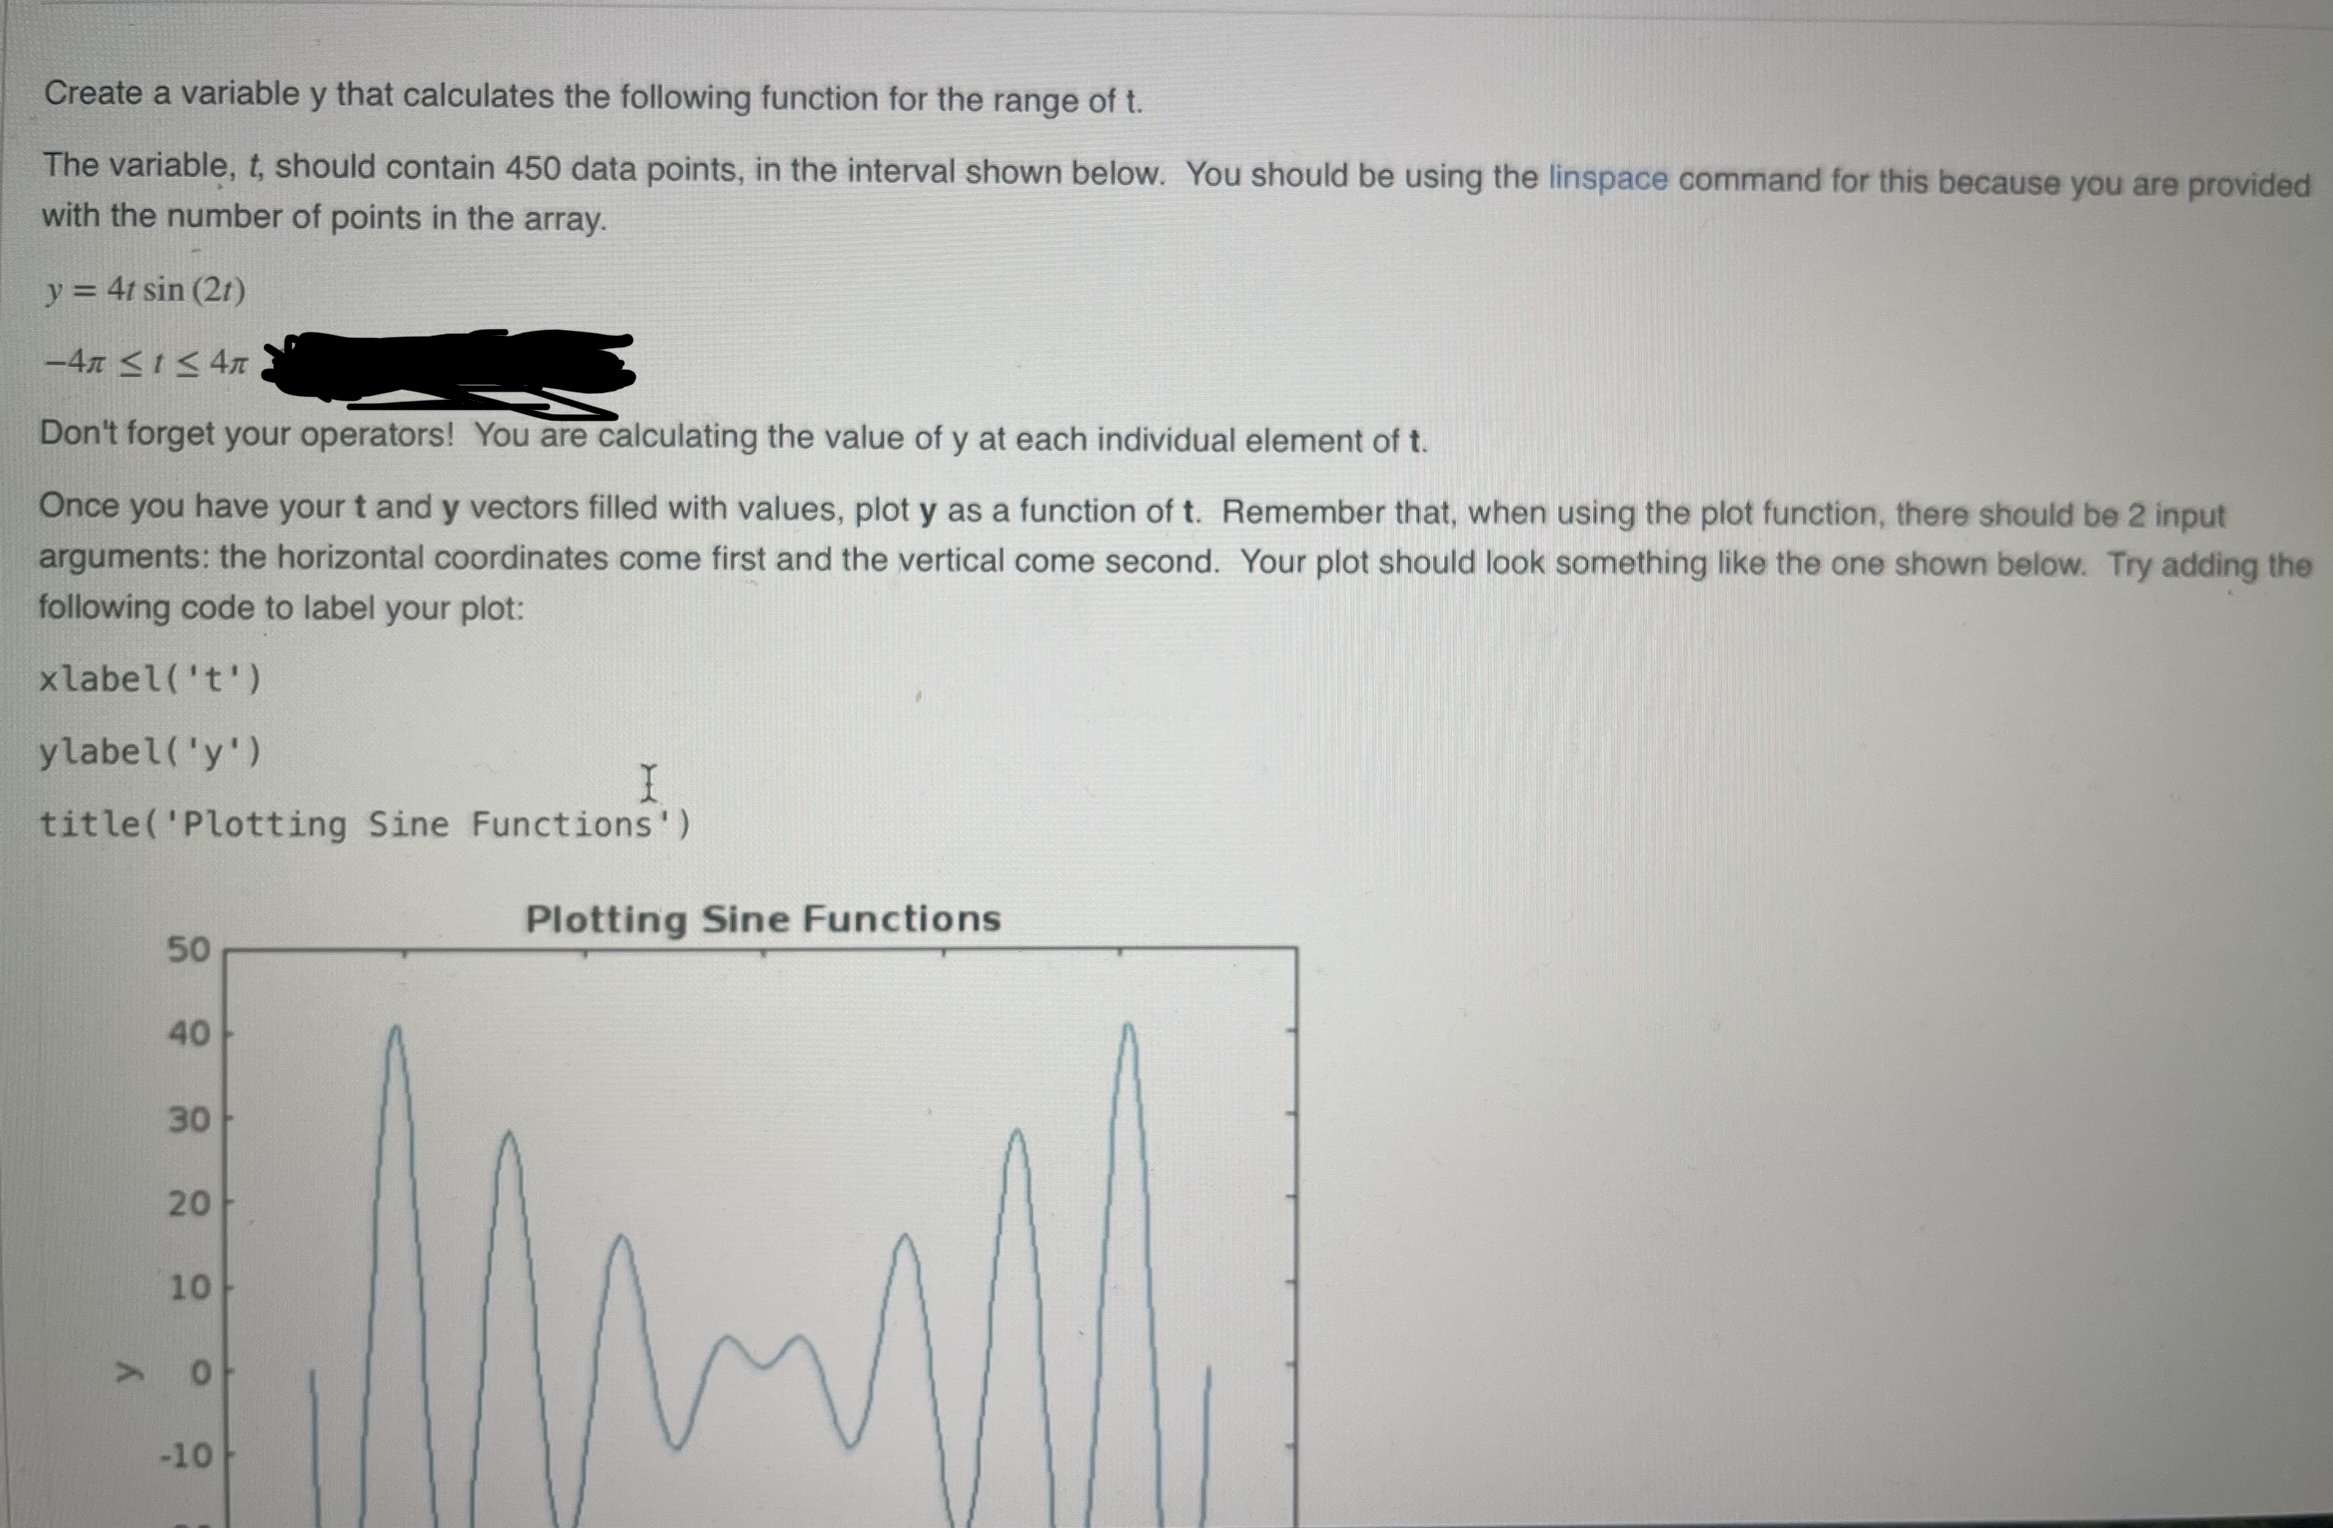
The variable, should contain data points, in the interval shown below. You should be using the linspace command for this because you are provided with the number of points in the array.
Don't forget your operators! You are calculating the value of at each individual element of
Once you have your and vectors filled with values, plot as a function of Remember that, when using the plot function, there should be input arguments: the horizontal coordinates come first and the vertical come second. Your plot should look something like the one shown below. Try adding the following code to label your plot:
label
ylabely
titlePlotting Sine Functions'
Step by Step Solution
There are 3 Steps involved in it
1 Expert Approved Answer
Step: 1 Unlock

Question Has Been Solved by an Expert!
Get step-by-step solutions from verified subject matter experts
Step: 2 Unlock
Step: 3 Unlock