

Question: Create a Xbar chart for the following data set. What is the upper control, center and lower control limit? Are any of our samples out
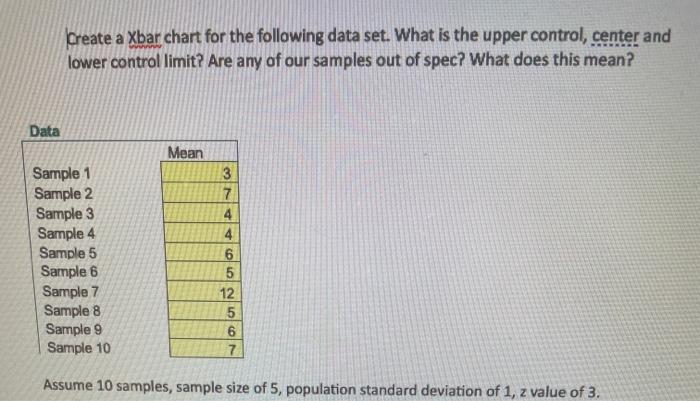
Create a Xbar chart for the following data set. What is the upper control, center and lower control limit? Are any of our samples out of spec? What does this mean? Assume 10 samples, sample size of 5 , population standard deviation of 1,z value of 3
Step by Step Solution
There are 3 Steps involved in it
1 Expert Approved Answer
Step: 1 Unlock

Question Has Been Solved by an Expert!
Get step-by-step solutions from verified subject matter experts
Step: 2 Unlock
Step: 3 Unlock