

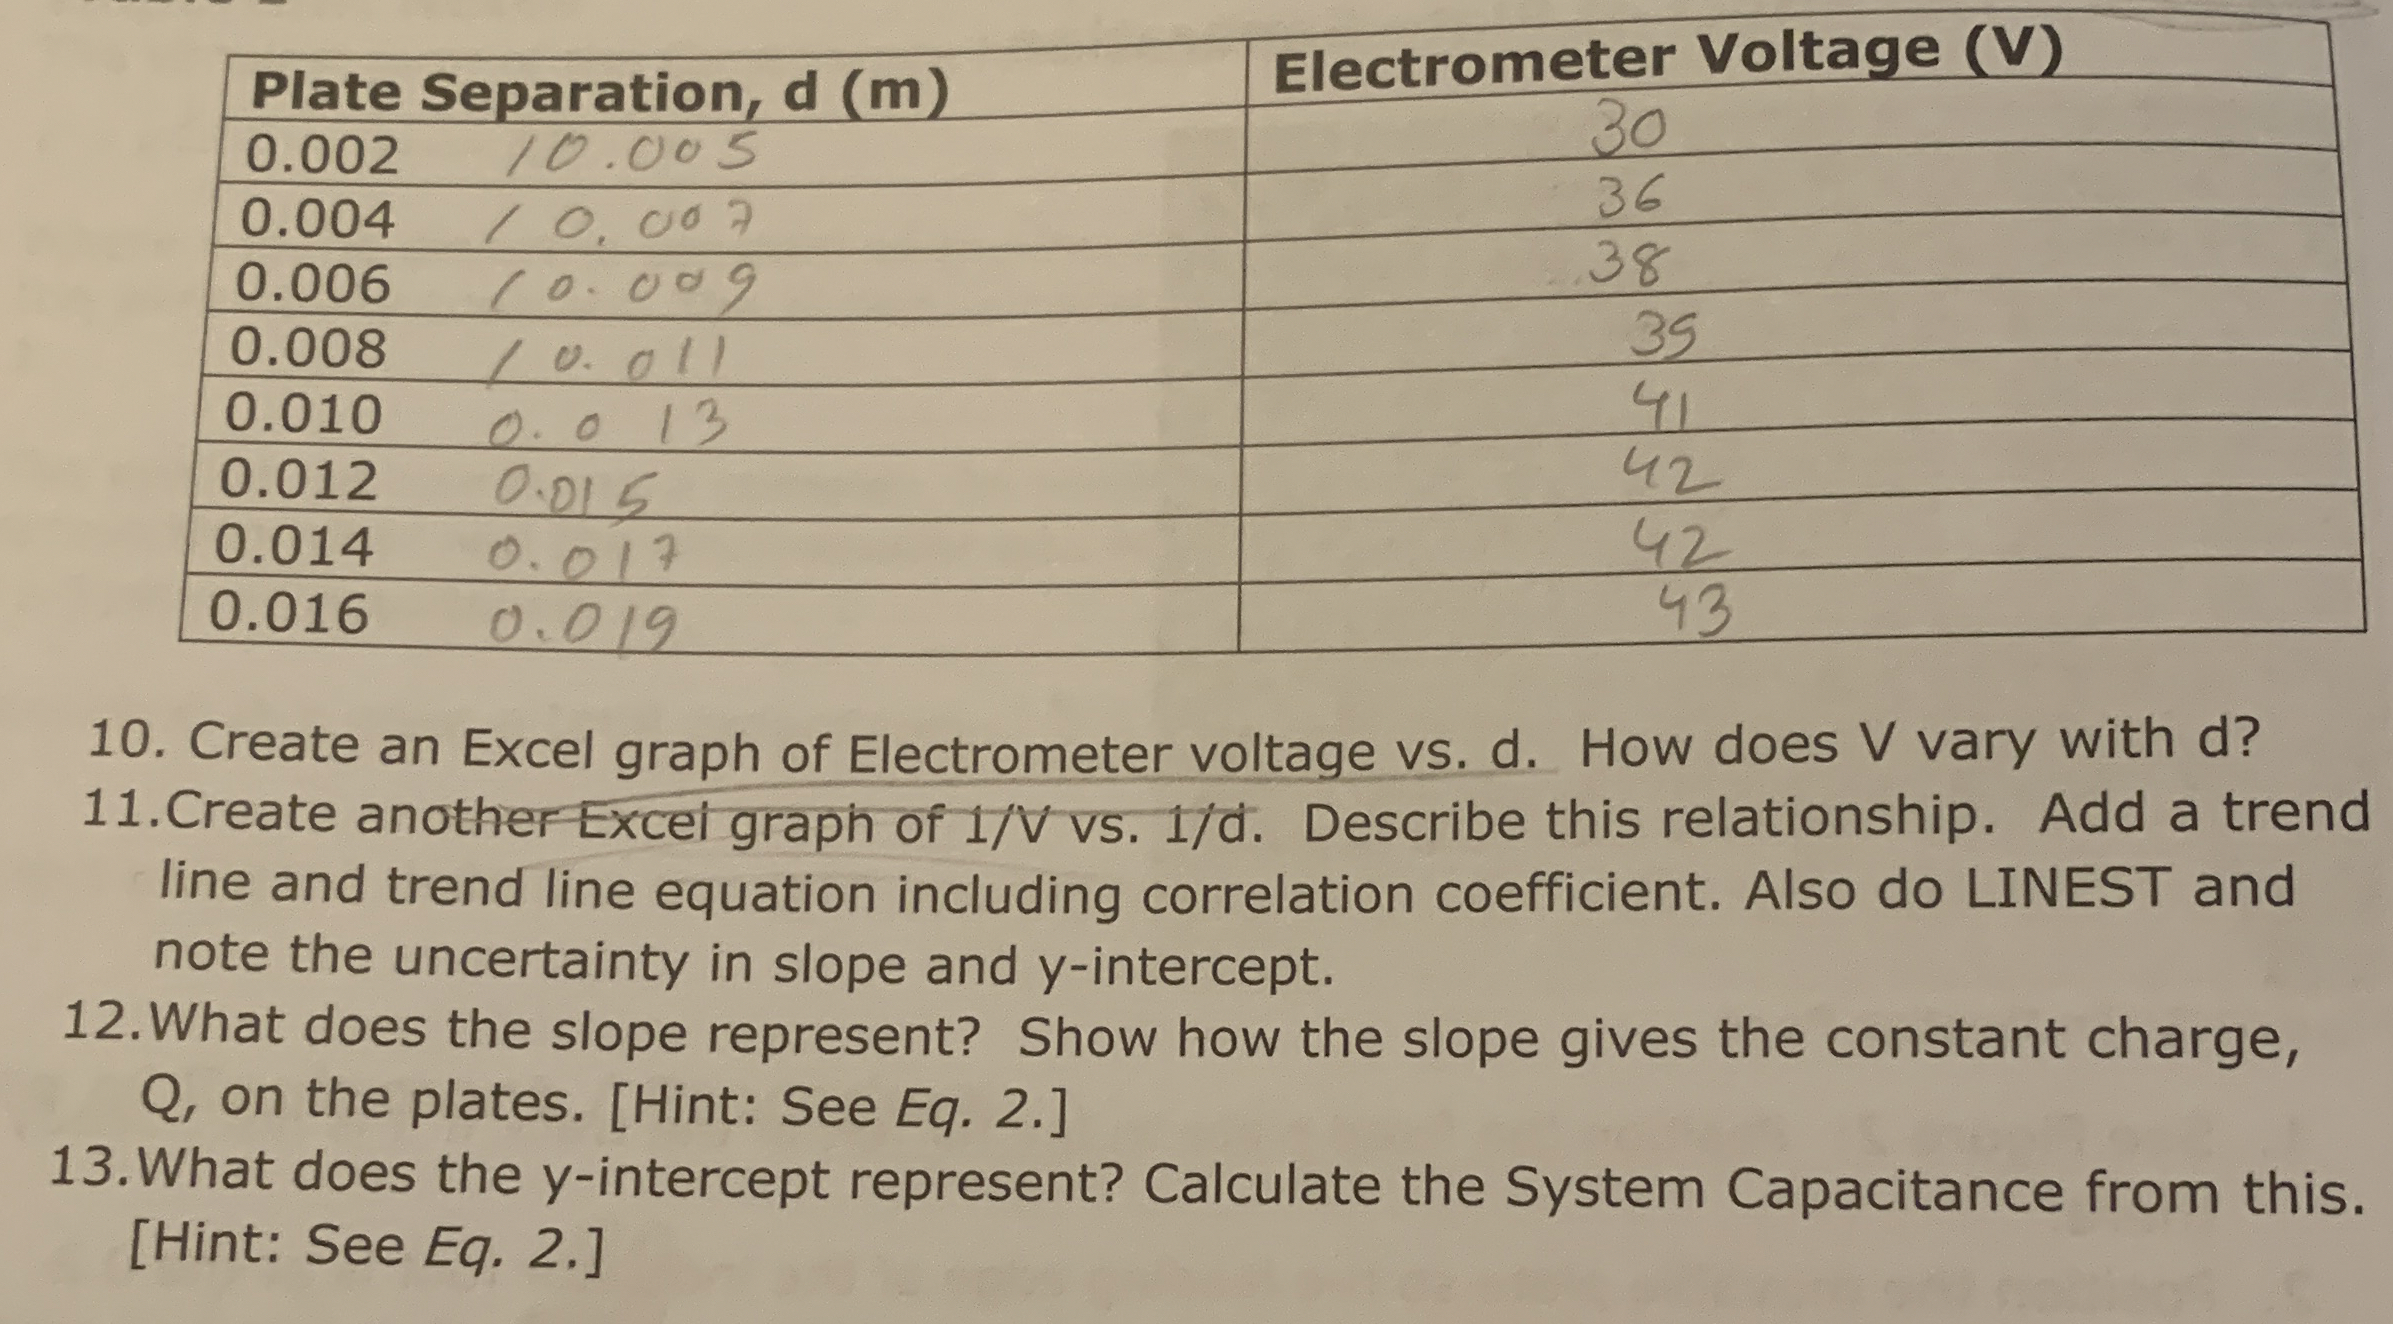
Question: Create an Excel graph of Electrometer voltage vs . d . How does V vary with d ? Create another Excel graph of 1 V
Create an Excel graph of Electrometer voltage vs d How does vary with d
Create another Excel graph of vsd Describe this relationship. Add a trend line and trend line equation including correlation coefficient. Also do LINEST and note the uncertainty in slope and intercept.
What does the slope represent? Show how the slope gives the constant charge, Q on the plates. Hint: See Eq
What does the intercept represent? Calculate the System Capacitance from this. Hint: See Eq
The diameter of the circular plate is m and the area is e m Please do and Thank you
Step by Step Solution
There are 3 Steps involved in it
1 Expert Approved Answer
Step: 1 Unlock

Question Has Been Solved by an Expert!
Get step-by-step solutions from verified subject matter experts
Step: 2 Unlock
Step: 3 Unlock