

Question: create numbers and companies from ur own Data: The data required for the empirical analysis is provided in the spreadsheet IC206 RESIT Project Data 2020-21.xlsx
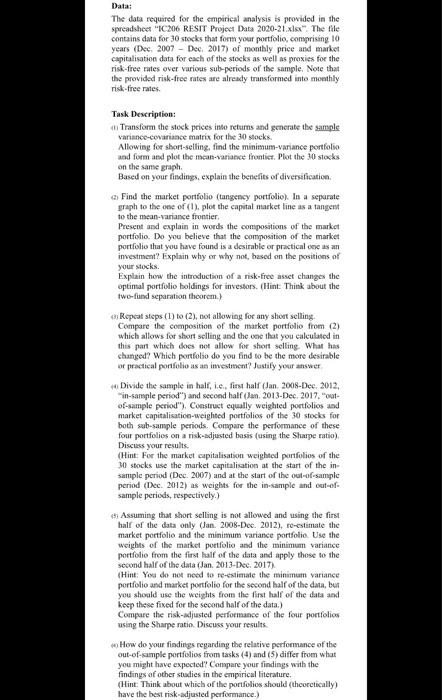
Data: The data required for the empirical analysis is provided in the spreadsheet "IC206 RESIT Project Data 2020-21.xlsx" The file contains data for 30 stocks that for your portfolio, comprising 10 years (Dec. 2007 - Dec 2017) of monthly price and market capitalisation data for each of the stocks as well as proxies for the risk-free rates over various sub-periods of the sample. Note that the provided risk-free rates are already transformed into monthly risk-free rates. Task Description: Transform the stock prices into returns and generate the sample variance-covariance matrix for the 30 socks Allowing for short-selling, find the minimum-variance portfolio and form and plot the mean-variance frontier. Plot the 30 stocks on the same graph Based on your findings, explain the benefits of diversification Find the market portfolio (tangency portfolio). In a separate graph to the one of (!), plot the capital market line as a tangent to the mean-variance frontier Present and explain in words the compositions of the market portfolio. Do you believe that the composition of the market portfolio that you have found is a desirable or practical one as an investment? Explain why or why not, based on the positions of your stocks. Explain how the introduction of a risk-free asset changes the optimal portfolio holdings for investors. (Hint: Think about the two-fund separation theorem.) Repeat steps (1) to (2), not allowing for any short selling Compare the composition of the market portfolio from (2) which allows for short selling and the one that you calculated in this part which does not allow for short selling What has changed? Which portfolio do you find to be the more desirable or practical portfolio as an investment? Justify your answer Divide the sample in half, ie, first half (Jan. 2008-Dec. 2012, in-sample period") and second half (Jan 2013-Dec 2017 out- of-sample period"), Construct equally weighted portfolios and market capitalisation-weighted portfolios of the 30 stocks for both sub-sample periods. Compare the performance of these four portfolios on a risk-adjusted basis (using the Sharpe ratio) Discuss your results. (Hint: For the market capitalisation weighted portfolios of the 30 stocks use the market capitalisation at the start of the in- sample period (Dec. 2007) and at the start of the out-of-sample period (Dec. 2012) as weights for the in-sample and out of sample periods, respectively.) Assuming that short selling is not allowed and using the first half of the data only (Jan. 2008-Dec. 2012), to-estimate the market portfolio and the minimum variance portfolio. Use the weights of the market portfolio and the minimum variance portfolio from the first half of the data and apply those to the second half of the data (Jan. 2013-Dec. 2017) (Hint: You do not need to re-estimate the minimum variance portfolio and market portfolio for the second half of the data, but you should use the weights from the first half of the data and keep these fixed for the second half of the data.) Compare the risk-adjusted performance of the four portfolios using the Sharpe ratio. Discuss your results. How do your findings regarding the relative performance of the out-of-sample portfolios from tasks (4) and (5) differ from what you might have expected Compare your findings with the findings of other studies in the empirical literature (Hint: Think about which of the portfolios should (theoretically) have the best risk-adjusted performance.) Data: The data required for the empirical analysis is provided in the spreadsheet "IC206 RESIT Project Data 2020-21.xlsx" The file contains data for 30 stocks that for your portfolio, comprising 10 years (Dec. 2007 - Dec 2017) of monthly price and market capitalisation data for each of the stocks as well as proxies for the risk-free rates over various sub-periods of the sample. Note that the provided risk-free rates are already transformed into monthly risk-free rates. Task Description: Transform the stock prices into returns and generate the sample variance-covariance matrix for the 30 socks Allowing for short-selling, find the minimum-variance portfolio and form and plot the mean-variance frontier. Plot the 30 stocks on the same graph Based on your findings, explain the benefits of diversification Find the market portfolio (tangency portfolio). In a separate graph to the one of (!), plot the capital market line as a tangent to the mean-variance frontier Present and explain in words the compositions of the market portfolio. Do you believe that the composition of the market portfolio that you have found is a desirable or practical one as an investment? Explain why or why not, based on the positions of your stocks. Explain how the introduction of a risk-free asset changes the optimal portfolio holdings for investors. (Hint: Think about the two-fund separation theorem.) Repeat steps (1) to (2), not allowing for any short selling Compare the composition of the market portfolio from (2) which allows for short selling and the one that you calculated in this part which does not allow for short selling What has changed? Which portfolio do you find to be the more desirable or practical portfolio as an investment? Justify your answer Divide the sample in half, ie, first half (Jan. 2008-Dec. 2012, in-sample period") and second half (Jan 2013-Dec 2017 out- of-sample period"), Construct equally weighted portfolios and market capitalisation-weighted portfolios of the 30 stocks for both sub-sample periods. Compare the performance of these four portfolios on a risk-adjusted basis (using the Sharpe ratio) Discuss your results. (Hint: For the market capitalisation weighted portfolios of the 30 stocks use the market capitalisation at the start of the in- sample period (Dec. 2007) and at the start of the out-of-sample period (Dec. 2012) as weights for the in-sample and out of sample periods, respectively.) Assuming that short selling is not allowed and using the first half of the data only (Jan. 2008-Dec. 2012), to-estimate the market portfolio and the minimum variance portfolio. Use the weights of the market portfolio and the minimum variance portfolio from the first half of the data and apply those to the second half of the data (Jan. 2013-Dec. 2017) (Hint: You do not need to re-estimate the minimum variance portfolio and market portfolio for the second half of the data, but you should use the weights from the first half of the data and keep these fixed for the second half of the data.) Compare the risk-adjusted performance of the four portfolios using the Sharpe ratio. Discuss your results. How do your findings regarding the relative performance of the out-of-sample portfolios from tasks (4) and (5) differ from what you might have expected Compare your findings with the findings of other studies in the empirical literature (Hint: Think about which of the portfolios should (theoretically) have the best risk-adjusted performance.)
Step by Step Solution
There are 3 Steps involved in it

Get step-by-step solutions from verified subject matter experts