

Question: Create one table that includes the CPU Utilization, Response Time, Waiting Time, Turnaround Time, and Average for both algorithms using the Gantt charts. S MLFQ
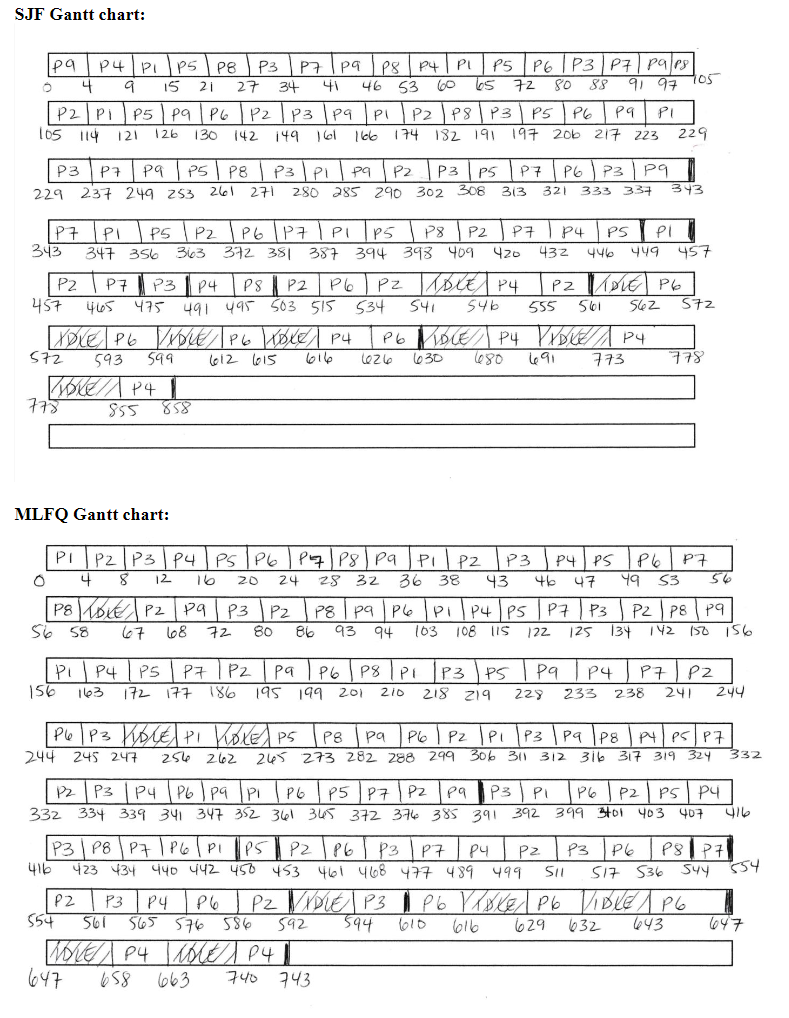
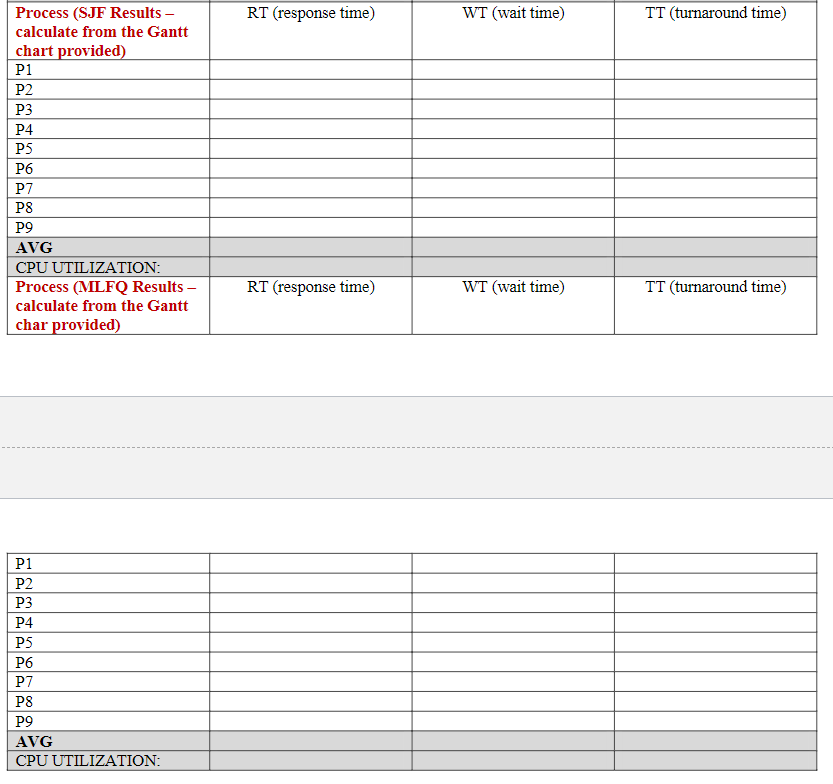
Create one table that includes the CPU Utilization, Response Time, Waiting Time, Turnaround Time, and Average for both algorithms using the Gantt charts.
S MLFQ Gantt chart: \begin{tabular}{|l|l|l|l|} \hline Process(SJFResults-calculatefromtheGanttchartprovided) & RT (response time) & WT (wait time) & TT (turnaround time) \\ \hline P1 & & & \\ \hline P2 & & & \\ \hline P3 & & & \\ \hline P4 & & & \\ \hline P5 & & & \\ \hline P6 & & & \\ \hline P7 & & & \\ \hline P9 & & & \\ \hline AVG & & & \\ \hline CPU UTILIZATION: & & & \\ \hline Process(MLFQResults-calculatefromtheGanttcharprovided) & RT (response time) & WT (wait time) & TT (turnaround time) \\ \hline \end{tabular} \begin{tabular}{|l|l|l|l|} \hline P1 & & & \\ \hline P2 & & & \\ \hline P3 & & & \\ \hline P4 & & & \\ \hline P5 & & & \\ \hline P6 & & & \\ \hline P7 & & & \\ \hline P8 & & & \\ \hline P9 & & & \\ \hline AVG & & & \\ \hline CPU UTILIZATION: & & & \\ \hline \end{tabular}
Step by Step Solution
There are 3 Steps involved in it

Get step-by-step solutions from verified subject matter experts