

Question: Create or find a data set that has seasonality, deseasonalize it and make a time series forecast. Show the bias and MSE of the
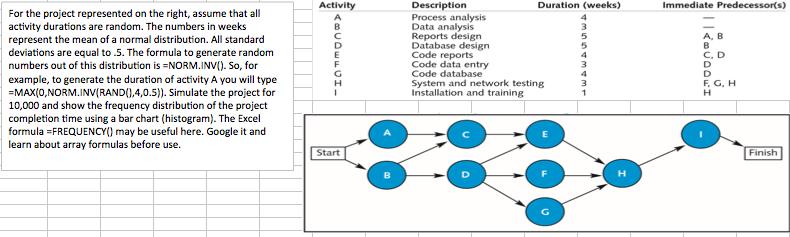
Create or find a data set that has seasonality, deseasonalize it and make a time series forecast. Show the bias and MSE of the model. Create another data set and discuss if and how that could be used for a causal forecast. Be specific, describe what your data represent and what the formulas do in a real life context, different from the spreadsheet posted on Blackboard. Do not use time of the day or day of the week as seasons, or price as a causal factor. Activity Description Duration (weeks) Immediate Predecessor(s) For the project represented on the right, assume that all activity durations are random. The numbers in weeks represent the mean of a normal distribution. All standard deviations are equal to .5. The formula to generate random numbers out of this distribution is =NORM.INV(). So, for example, to generate the duration of activity A you will type =MAX(0,NORM.INV(RAND(),4,0.5). Simulate the project for 10,000 and show the frequency distribution of the project completion time using a bar chart (histogram). The Excel formula =FREQUENCY() may be useful here. Google it and learn about array formulas before use. Process analysis Data analysis Reports design Database design Code reports Code data entry Code database System and network testing Installation and training B F. G, H Start Finish
Step by Step Solution
3.43 Rating (166 Votes )
There are 3 Steps involved in it
First Problem Forecasting The data and the time series plot is shown as following Year Quarter Time Sales 1 1 1 148 2 2 252 3 3 273 4 4 249 2 1 5 139 2 6 221 3 7 260 4 8 260 3 1 9 141 2 10 246 3 11 29... View full answer

Get step-by-step solutions from verified subject matter experts