

Question: Create scatterplots using the data in the spreadsheet linked above and display the equation for the regression line. What is the equation for the
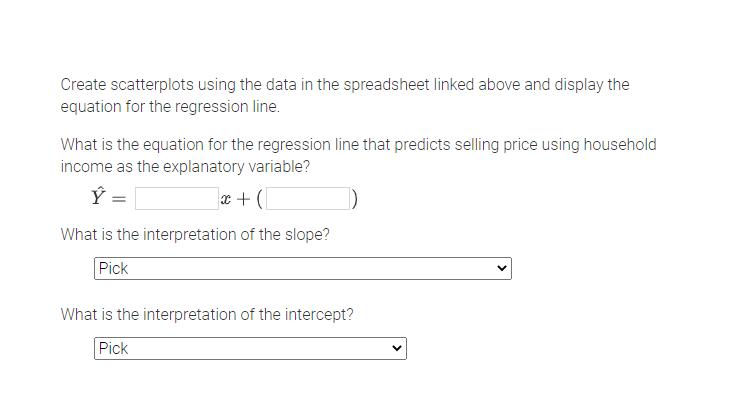
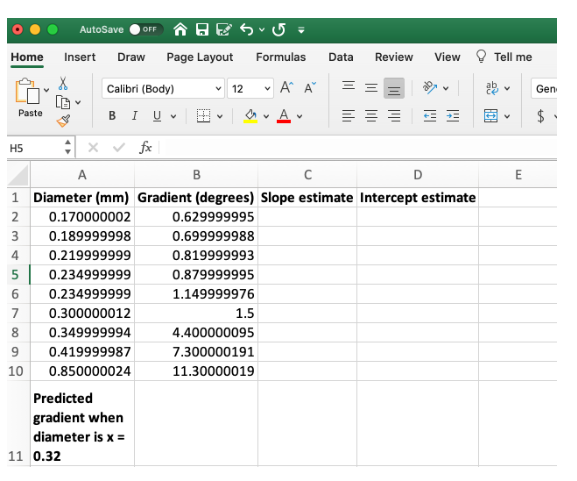
Create scatterplots using the data in the spreadsheet linked above and display the equation for the regression line. What is the equation for the regression line that predicts selling price using household income as the explanatory variable? = x+( What is the interpretation of the slope? Pick What is the interpretation of the intercept? Pick AutoSave OFF -5 Home Insert Draw Page Layout Formulas Data Review View Tell me Calibri (Body) 12 ' = Paste BI U H5 fx A B D E 1 Diameter (mm) Gradient (degrees) Slope estimate Intercept estimate 2 0.170000002 0.629999995 3 0.189999998 0.699999988 4 0.219999999 0.819999993 5 0.234999999 0.879999995 6 0.234999999 1.149999976 7 0.300000012 1.5 8 0.349999994 4.400000095 9 0.419999987 7.300000191 10 0.850000024 11.30000019 Predicted gradient when diameter is x = 11 0.32 Gen $
Step by Step Solution
There are 3 Steps involved in it

Get step-by-step solutions from verified subject matter experts