

Question: The bootstrap distribution in Figure 3.19(c), generated for a sample correlation. Figure 3.19 c. Use the bootstrap distributions in Figure 3.19 to estimate the point
The bootstrap distribution in Figure 3.19(c), generated for a sample correlation.
Figure 3.19 c.
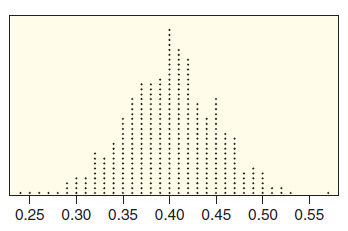
Use the bootstrap distributions in Figure 3.19 to estimate the point estimate and standard error, and then use this information to give a 95% confidence interval. In addition, give notation for the parameter being estimated.
0.25 0.30 0.35 0.40 0.45 0.50 0.55
Step by Step Solution
★★★★★
3.51 Rating (154 Votes )
There are 3 Steps involved in it
1 Expert Approved Answer
Step: 1 Unlock

The distribution appears to be centered near 04 so the point estimate is about 04 ... View full answer
Question Has Been Solved by an Expert!
Get step-by-step solutions from verified subject matter experts
Step: 2 Unlock
Step: 3 Unlock