

Question: Create table or figure (bar graph) in APAstyle using the data from the picture below i don't know how to do it on excel or
Create table or figure (bar graph) in APAstyle using the data from the picture below
i don't know how to do it on excel or word :(
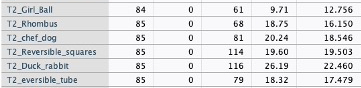
T2_Girl_Ball 84 61 9.71 12.756 12_Rhombus 85 68 18.75 16.150 T2_chef_dog 85 81 20.24 18.546 T2 Reversible_squares 85 114 19.60 19.503 T2_Duck_rabbit 85 116 26.19 22.460 T2_eversible_tube 85 79 18.32 17.479
Step by Step Solution
There are 3 Steps involved in it
1 Expert Approved Answer
Step: 1 Unlock

Question Has Been Solved by an Expert!
Get step-by-step solutions from verified subject matter experts
Step: 2 Unlock
Step: 3 Unlock