

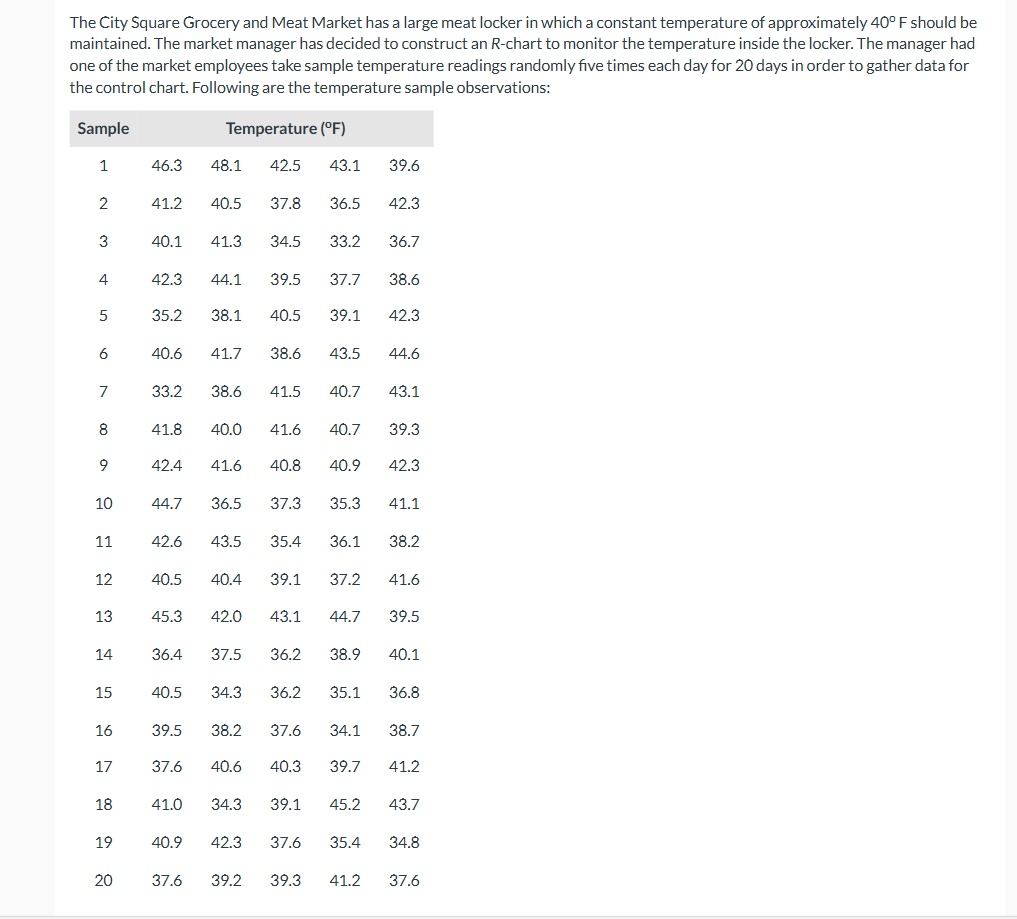
Question: Create the x - bar chart. Be sure to show your calculations for the UCL, CL , and LCL . Divide the control chart into
Create the xbar chart. Be sure to show your calculations for the UCL, CL and LCL Divide the control chart into zones show the values associated with each zone boarder Perform the pattern test by completing the attached table and indicating if any patterns exist. Make sure your graph is clean and precise. PLEASE FOLLOW THE GUIDELINES. I NEED TO SEE HOW THE PATTERN TEST IS DONE AND WHAT THE ACTUAL XBAR CHART WILL LOOK LIKE WITH ZONES.
Step by Step Solution
There are 3 Steps involved in it
1 Expert Approved Answer
Step: 1 Unlock

Question Has Been Solved by an Expert!
Get step-by-step solutions from verified subject matter experts
Step: 2 Unlock
Step: 3 Unlock