

Question: Quality Management. R chart and x bar chart. please help grand average is 300! thank you. 20 Twenty five propeded for en stor ut. The
Quality Management. R chart and x bar chart. please help 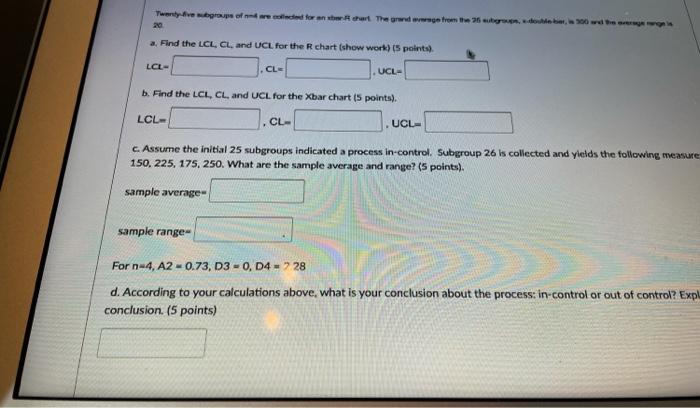
grand average is 300! thank you. 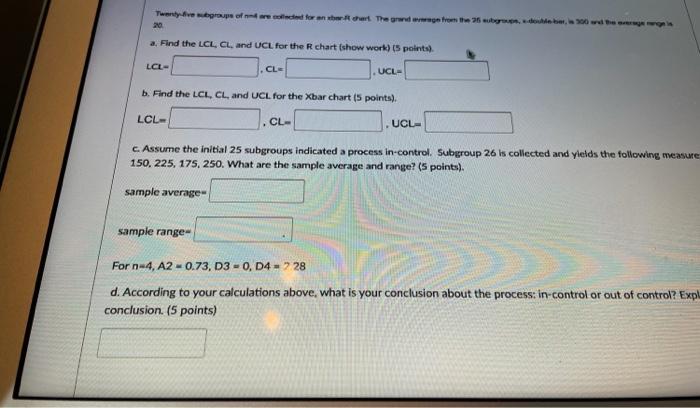
20 Twenty five propeded for en stor ut. The ground from 16 y., w a. Find the LCI, CL, and UCL. for the chart (show work) (points) LCL- CLE UCLE b. Find the LCL, CL, and UCL for the Xbar chart (5 points) LCL CL- UCL c. Assume the initial 25 subgroups indicated a process in control. Subgroup 26 is collected and yields the following measure 150, 225, 175. 250. What are the sample average and range? (5 points) sample average- sample range For n-4, A2 -0.73, D3 - 0, D4 = 728 d. According to your calculations above, what is your conclusion about the process: in-control or out of control? Expl conclusion (5 points) 20 Twenty five prope of weed for her at the grand from the web a. Find the LCI, CL, and UCL. for the chart tshow work) points) LCL- CL UCL- b. Find the LCL, CL, and UCL for the Xbar chart (5 points) LCL- CL- UCL c. Assume the initial 25 subgroups indicated a process in-control. Subgroup 26 is collected and yields the following measure 150, 225, 175, 250. What are the sample average and range? (5 points). sample average- sample range For n-4, A2 -0.73, D3 - 0, D4 - 7 28 d. According to your calculations above, what is your conclusion about the process: in-control or out of control? Expl conclusion (5 points)
Step by Step Solution
There are 3 Steps involved in it
1 Expert Approved Answer
Step: 1 Unlock

Question Has Been Solved by an Expert!
Get step-by-step solutions from verified subject matter experts
Step: 2 Unlock
Step: 3 Unlock