

Question: Create three scenarios for scenario inputs given. Outputs are Terminal Value and Enterprise Value Create a Data Table that shows sensitivity of Enterprise Value
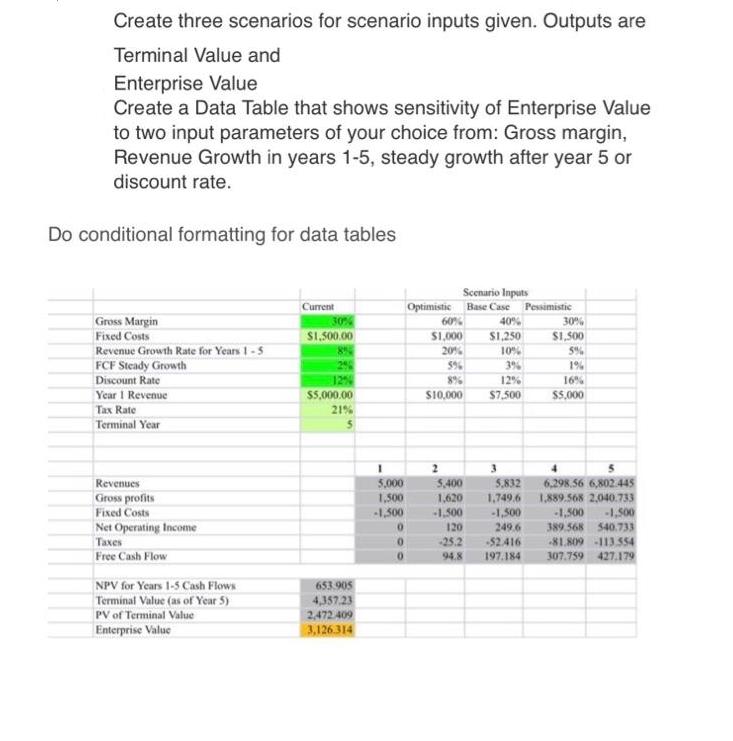
Create three scenarios for scenario inputs given. Outputs are Terminal Value and Enterprise Value Create a Data Table that shows sensitivity of Enterprise Value to two input parameters of your choice from: Gross margin, Revenue Growth in years 1-5, steady growth after year 5 or discount rate. Do conditional formatting for data tables Gross Margin Fixed Costs Revenue Growth Rate for Years 1-5 FCF Steady Growth Discount Rate Year 1 Revenue Tax Rate Terminal Year Revenues Gross profits Fixed Costs Net Operating Income Taxes Free Cash Flow NPV for Years 1-5 Cash Flows Terminal Value (as of Year 5) PV of Terminal Value Enterprise Value Current 30% $1,500.00 12% $5,000.00 21% 653.905 4,357.23 2,472.409 3,126.314 1 5,000 1,500 -1,500 0 0 Optimistic 60% $1,000 20% 5% 8% $10,000 Scenario Inputs Base Case 2 5,400 1,620 -1.500 120 -25.2 94.8 40% $1,250 10% 3% 12% $7,500 Pessimistic 30% $1,500 5% 1% 16% $5,000 5,832 6,298.56 6,802.445 1,749,6 1,889.568 2,040.733 -1,500 249.6 -52.416 197.184 -1,500 -1,500 389.568 540.733 -81.809 -113.554 307.759 427.179
Step by Step Solution
3.54 Rating (151 Votes )
There are 3 Steps involved in it

Get step-by-step solutions from verified subject matter experts