

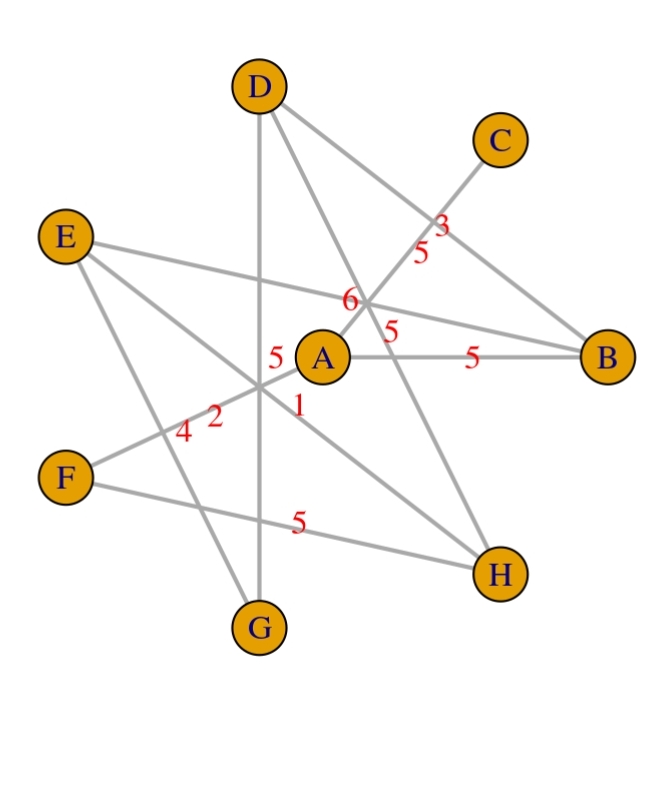
Question: Create your graph. Each student will receive a unique weighted, undirected graph based on their ID number. To create your graph, go to the Canvas
Create your graph. Each student will receive a unique weighted, undirected graph based on their
ID number. To create your graph, go to the Canvas assignment page for the Investigative Report
and enter your details student ID and last name The graph will appear for you to download. If
you lose your graph, you can return and retrieve it by entering your details again.
Decide on a context. Graphs come from multiple reallife situations. Some were discussed in the
lectures and tutorials. You are to think of one that is appropriate for your graph. This will be used
in the introduction to your report. Here are some examples you may like to use although you
may not copy and paste my wording or you can use one your own:
A company has hired you to analyse their company website. The vertices represent the
pages on the website, the edges represent which pages link to each other assume that
no page links to another page without it linking back and the weights represent how far
down the page the link is top, bottom;
Analyse the graph. Investigate the graph. Think of what we discussed in lectures and tutorials.
Calculate important quantities, see if you can find different characteristics and components of
the graph. Your investigation should include:
o The number of vertices and edges;
o The degrees of the vertices;
o Whether it is connected;
o The edgeendpoint function;
o The presence or absence of types of walks trailspathscircuits Euler, Hamiltonian;
o The minimal spanning tree and what algorithm you used to find it; and
o Anything else that you find of interest.
Write the report. Do NOT just list what you found. You are to write a report that has a structure
to it It should not be handwritten. It should have:
o A title. Give the report a title based on your context.
o An introduction. Introduce the problem you decided on and the graph that you have
include the image with a caption and reference it intext Explain why you are analysing
it why would it be useful to know these things
o A body. Discuss your analysis. What did you find? Would this have any specific meaning
for your problem? Write in full sentences and paragraphs. Include any images that would
illustrate your points or are important graphs.
o A conclusion. Briefly summarise your report and relate it back to your context.
o Images. You are analysing something visual, include any imagesgraphs that are
appropriate these could be annotated to show features of the graph Ensure they all
have captions describing what they are if I take it out of the report, then is it still
understandable what is being shown? and are all referenced in text by the number.
Step by Step Solution
There are 3 Steps involved in it
1 Expert Approved Answer
Step: 1 Unlock

Question Has Been Solved by an Expert!
Get step-by-step solutions from verified subject matter experts
Step: 2 Unlock
Step: 3 Unlock