

Question: Creating an ROC Plot. Please code in Python, R, or Matlab. The files to downloand can be found here https://files.fm/u/hjurwu3m In HW3, we will infer
Creating an ROC Plot. Please code in Python, R, or Matlab. The files to downloand can be found here https://files.fm/u/hjurwu3m
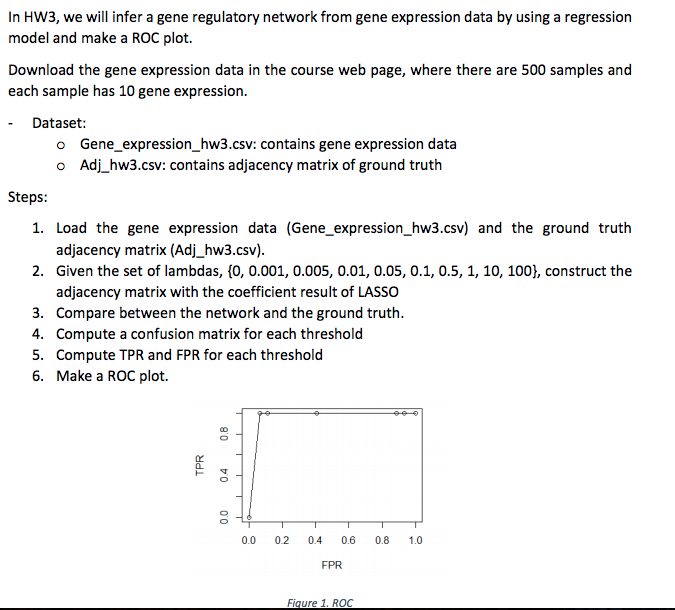
In HW3, we will infer a gene regulatory network from gene expression data by using a regression model and make a ROC plot. Download the gene expression data in the course web page, where there are 500 samples and each sample has 10 gene expression. Dataset: o Gene_expression_hw3.csv: contains gene expression data o Adj hw3.csv: contains adjacency matrix of ground truth 1. Load the gene expression data (Gene_expression_hw3.csv) and the ground truth adjacency matrix (Adj_hw3.csv). 2. Given the set of lambdas, [0, 0.001, 0.005, 0.01, 0.05, 0.1, 0.5, 1,10, 100), construct the adjacency matrix with the coefficient result of LASSOo 3. Compare between the network and the ground truth 4. Compute a confusion matrix for each threshold 5. Compute TPR and FPR for each threshold 6. Make a ROC plot. 0.0 0.2 04 0.6 0.8 1.0 FPR Fiqure 1, ROC
Step by Step Solution
There are 3 Steps involved in it

Get step-by-step solutions from verified subject matter experts