

Question: Description: We learned in class that the Receiver Operator Characteristic curve ( ROC ) gives us all the information we need to distinguish sensitivity from
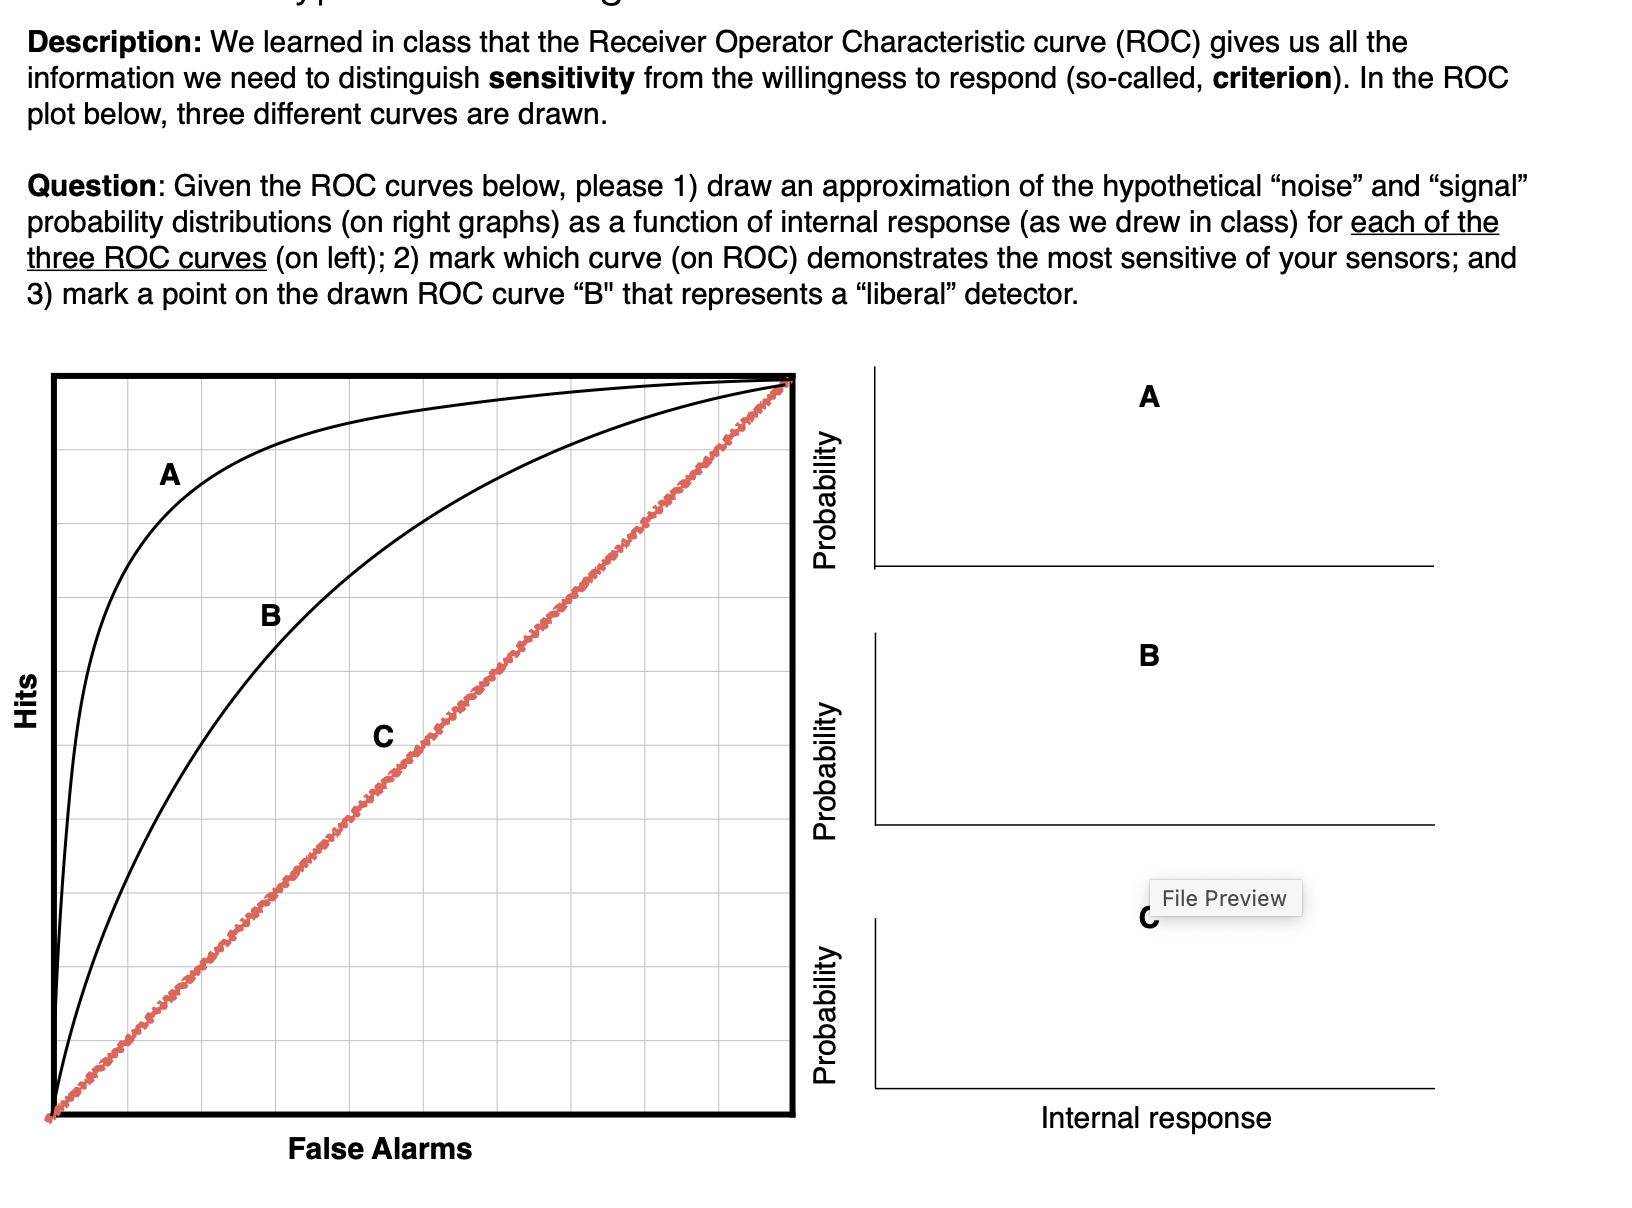
Description: We learned in class that the Receiver Operator Characteristic curve ROC gives us all the information we need to distinguish sensitivity from the willingness to respond socalled, criterion In the ROC plot below, three different curves are drawn.
Question: Given the ROC curves below, please draw an approximation of the hypothetical "noise" and "signal" probability distributions on right graphs as a function of internal response as we drew in class for each of the three ROC curves on left; mark which curve on ROC demonstrates the most sensitive of your sensors; and mark a point on the drawn ROC curve B that represents a "liberal" detector.
Step by Step Solution
There are 3 Steps involved in it
1 Expert Approved Answer
Step: 1 Unlock

Question Has Been Solved by an Expert!
Get step-by-step solutions from verified subject matter experts
Step: 2 Unlock
Step: 3 Unlock