

Question: Ct _ Considerthe one-sample t test with a normal population N (in :72): ; d _ H0:o=0versusH1:o>0. 2%,? S- a g _ a. Suppose the
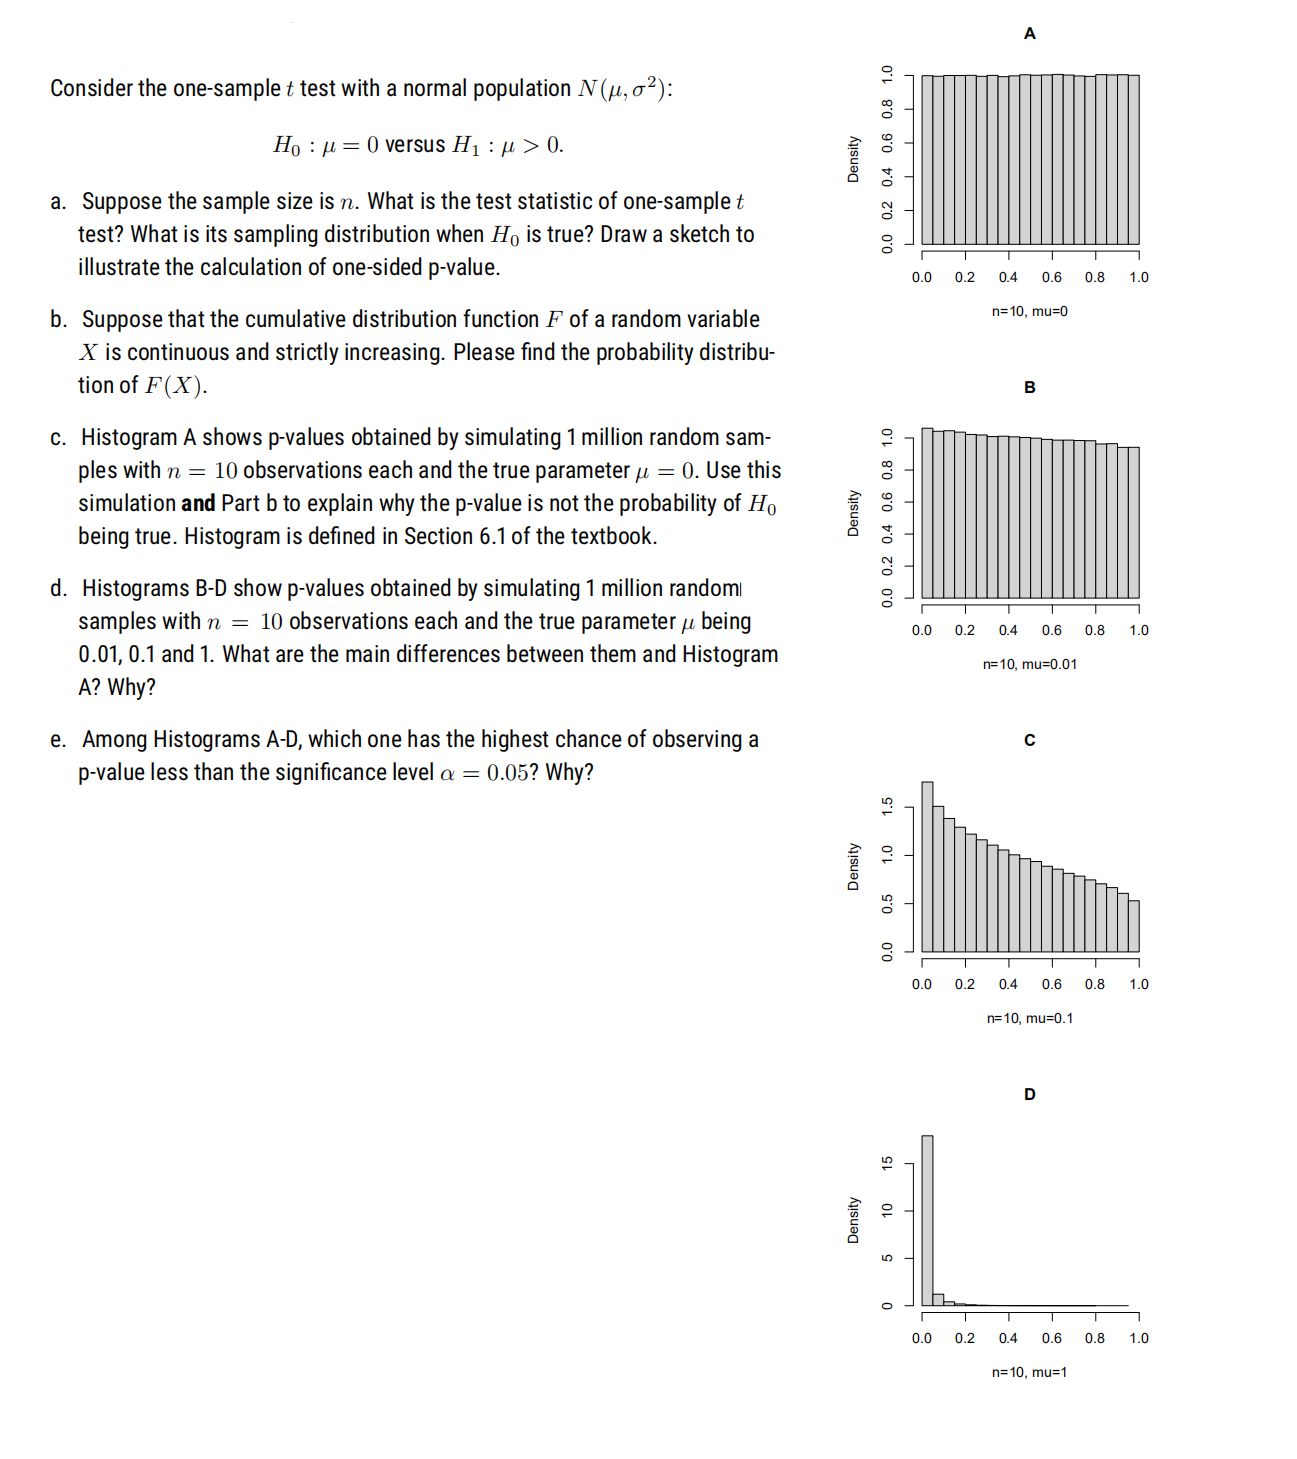
Ct _ Considerthe one-sample t test with a normal population N (in :72): ; d _ H0:o=0versusH1:o>0. 2%,? S- a g _ a. Suppose the sample size is n. What is the test statistic of one-samplet g , test? What is its sampling distribution when H0 is true? Draw a sketch to g _ Illustrate the calculation of one-srded pvalue. on 02 Q4 05 0.3 1.0 b. Suppose that the cumulative distribution function F of a random variable ":10' \""30 X is continuous and strictly increasing. Please find the probability distribu- tion of F(X). a c. Histogram A shows p-values obtained by simulating 1 million random sam- 3 ples with n = 10 observations each and thetrue parameter p. = 0. Use this 3 simulation and Part b to explain why the p-value is not the probability of Ho E 3 being true. Histogram is defined in Section 6.1 of the textbook. '3 E d. Histograms 3-0 show pvalues obtained by simulating 1 million randoml g samples With 71 = 10 observations each and the true parametero being 0.0 02 Q4 0.6 0.3 1.0 0.01, 0.1 and 1. What are the main differences between them and Histogram F10.mu:0.01 A? Why? e. Among Histograms AD, which one has the highest chance of observing a c pvalue less than the significance level a = 0.05? Why? |Q ca E u? O Q o llllll 0.0 0.2 0.4 0.6 0.8 1.0 n=1o, mu=0.1 D If) 2 E I) O 0.0 0.2 0.4 0.6 0.8 1.0 n:10, mu:1
Step by Step Solution
There are 3 Steps involved in it

Get step-by-step solutions from verified subject matter experts