

Question: Consider the one-sample t test with a normal population N(/, q2): Ho : / = 0 versus H1 : / > 0. Density 0.0 0.2

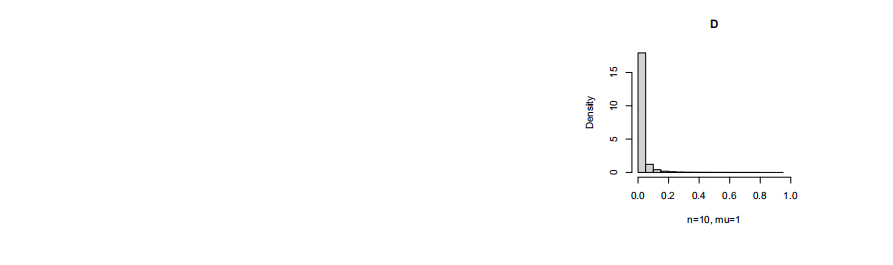
Consider the one-sample t test with a normal population N(/, q2): Ho : / = 0 versus H1 : / > 0. Density 0.0 0.2 04 0.6 0.8 1.0 a. Suppose the sample size is n. What is the test statistic of one-sample t test? What is its sampling distribution when Ho is true? Draw a sketch to illustrate the calculation of one-sided p-value. 0.0 0.2 0.4 0.6 0.8 1.0 b. Suppose that the cumulative distribution function F of a random variable n=10, mu=0 X is continuous and strictly increasing. Please find the probability distribu- tion of F(X). B c. Histogram A shows p-values obtained by simulating 1 million random sam- ples with n = 10 observations each and the true parameter / = 0. Use this simulation and Part b to explain why the p-value is not the probability of Ho Density 0.0 0.2 0.4 0.6 0.8 1.0 being true. Histogram is defined in Section 6.1 of the textbook. d. Histograms B-D show p-values obtained by simulating 1 million random samples with n = 10 observations each and the true parameter / being 0.0 0.2 0.4 0.6 0.8 1.0 0.01, 0.1 and 1. What are the main differences between them and Histogram n=10, mu=0.01 A? Why? e. Among Histograms A-D, which one has the highest chance of observing a C p-value less than the significance level o = 0.05? Why? 1.0 Density 0.0 0.5 0.0 0.2 0.4 0.6 0.8 1.0 n=10, mu=0.1\f
Step by Step Solution
There are 3 Steps involved in it

Get step-by-step solutions from verified subject matter experts