

Question: Current Analysis of Operations- Find the horizontal (not trend) analysis for three years. Round amounts to the percentages to the nearest one-tenth of a percent.
Current Analysis of Operations- Find the horizontal (not trend) analysis for three years. Round amounts to the percentages to the nearest one-tenth of a percent. compare each item on the statement 2016 to 2017 and again 2017 to 2018. 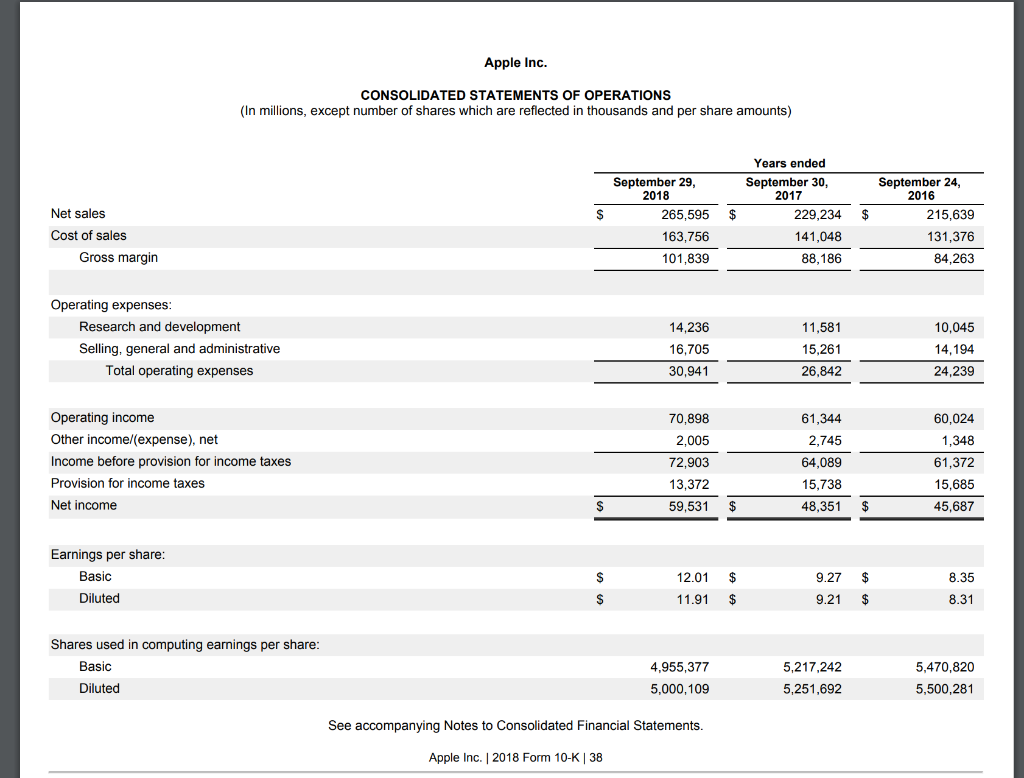
Apple Inc. CONSOLIDATED STATEMENTS OF OPERATIONS (In millions, except number of shares which are reflected in thousands and per share amounts) $ September 29, 2018 265,595 163,756 101,839 $ Net sales Cost of sales Gross margin Years ended September 30, 2017 229,234 141,048 88,186 $ September 24, 2016 215,639 131,376 84,263 Operating expenses: Research and development Selling, general and administrative Total operating expenses 14,236 16,705 30,941 11,581 15,261 26,842 10,045 14,194 24,239 Operating income Other income/expense), net Income before provision for income taxes Provision for income taxes Net income 70,898 2,005 72,903 13,372 59,531 $ 61,344 2,745 64,089 15,738 48,351 60,024 1,348 61,372 15,685 45,687 $ $ Earnings per share: Basic Diluted 8.35 12.01 $ 11.91 $ 9.27 9.21 $ $ 8.31 Shares used in computing earnings per share: Basic Diluted 5.000,109 4,955,377 5,000,109 5.257.242 5,217.242 5,251,692 5,470,820 5,500,281 See accompanying Notes to Consolidated Financial Statements. Apple Inc. 2018 Form 10- K38
Step by Step Solution
There are 3 Steps involved in it

Get step-by-step solutions from verified subject matter experts