

Question: Current Attempt in Progress (Common-size analysis and differences in profitability) Comparative financial statement data for First Ltd. and Supreme Ltd., two competitors, follow: Capitalassets(net)CurrentliabilitiesLong-termliabilitiesSharecapitalRetainedearnings424,80057,14066,110331,000145,270338,27044,71087,920255,000101,7101,410,300227,470686,8501,101,000315,4801,527,850218,370524,7901,109,000473,030 Prepare
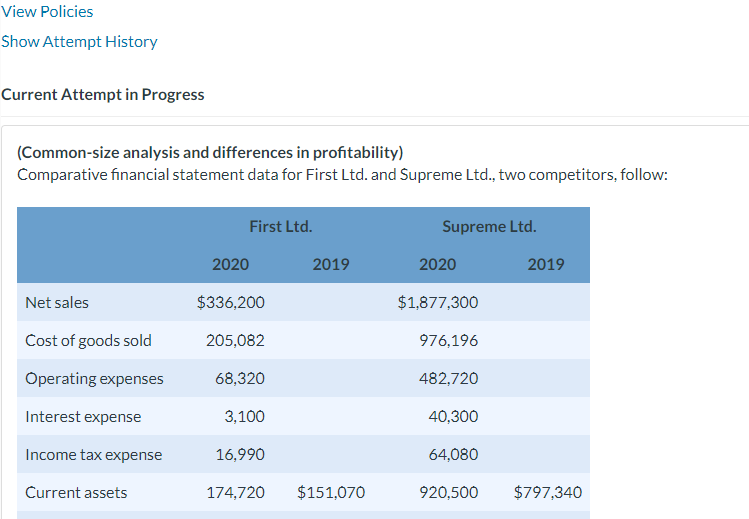
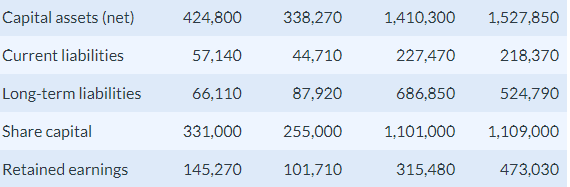
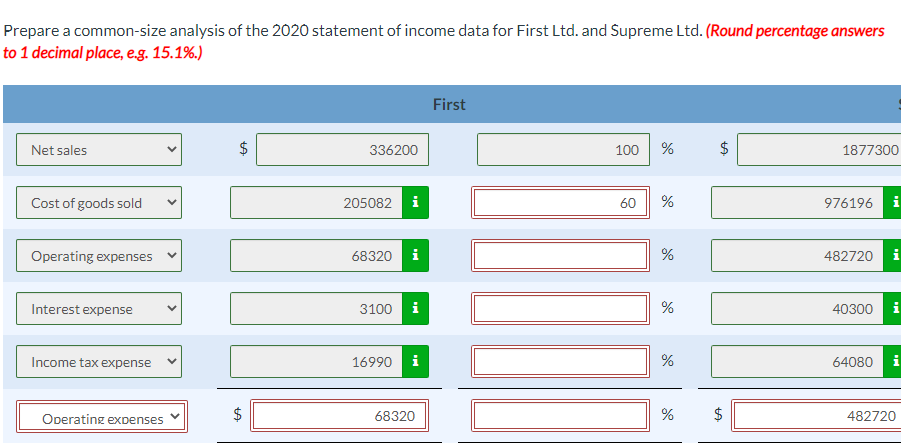
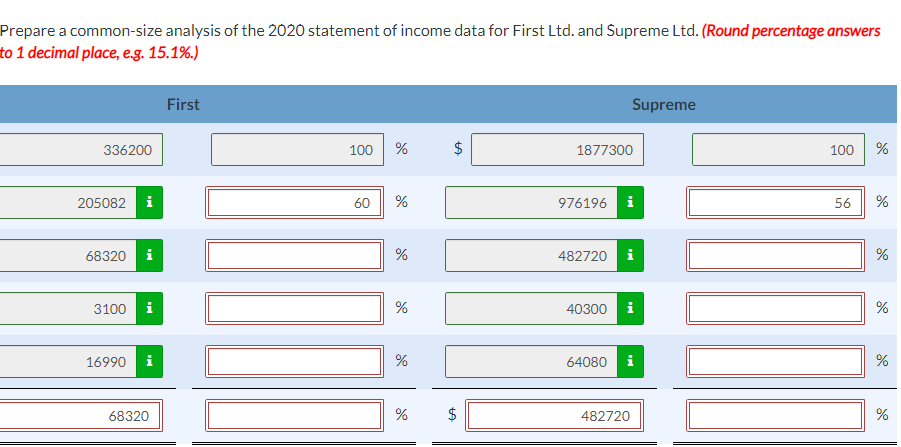
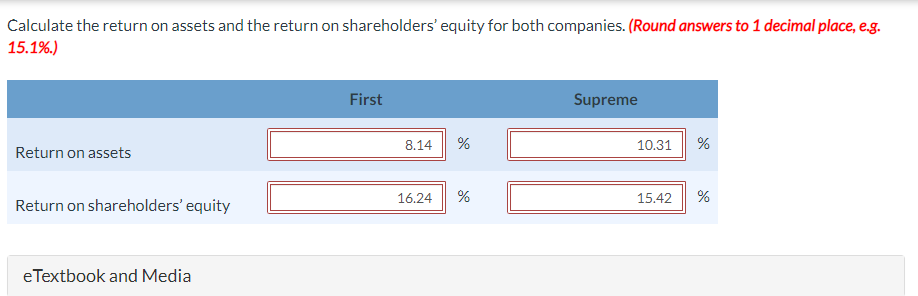
Current Attempt in Progress (Common-size analysis and differences in profitability) Comparative financial statement data for First Ltd. and Supreme Ltd., two competitors, follow: Capitalassets(net)CurrentliabilitiesLong-termliabilitiesSharecapitalRetainedearnings424,80057,14066,110331,000145,270338,27044,71087,920255,000101,7101,410,300227,470686,8501,101,000315,4801,527,850218,370524,7901,109,000473,030 Prepare a common-size analysis of the 2020 statement of income data for First Ltd. and Supreme Ltd. (Round percentage answers to 1 decimal place, e.g. 15.1\%.) Prepare a common-size analysis of the 2020 statement of income data for First Ltd. and Supreme Ltd. (Round percentage answers o 1 decimal place, e.g. 15.1\%.) Calculate the return on assets and the return on shareholders' equity for both companies. (Round answers to 1 decimal place, e.g. 15.1\%.)
Step by Step Solution
There are 3 Steps involved in it

Get step-by-step solutions from verified subject matter experts