

Question: customer orders. You find an average of 6 errors per order. What would the UCL of the appropriate control chart be, using Z=2 ? 2
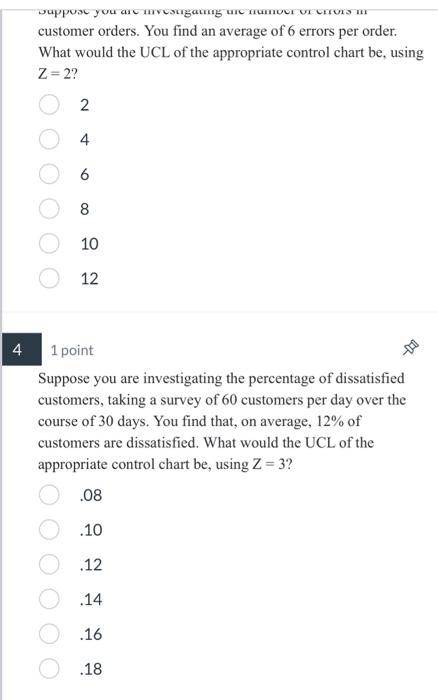
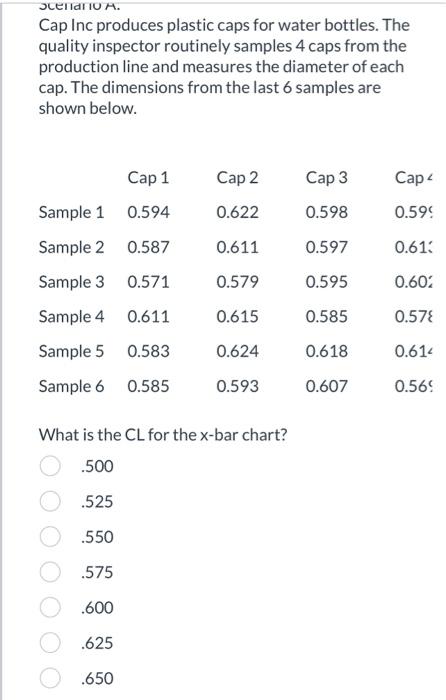
customer orders. You find an average of 6 errors per order. What would the UCL of the appropriate control chart be, using Z=2 ? 2 4 6 8 10 12 1 point Suppose you are investigating the percentage of dissatisfied customers, taking a survey of 60 customers per day over the course of 30 days. You find that, on average, 12% of customers are dissatisfied. What would the UCL of the appropriate control chart be, using Z=3 ? .08 .10 .12 .14 .16 .18 JCEIIIOA. Cap Inc produces plastic caps for water bottles. The quality inspector routinely samples 4 caps from the production line and measures the diameter of each cap. The dimensions from the last 6 samples are shown below. What is the CL for the x-bar chart? .500.525.550.575.600.625.650
Step by Step Solution
There are 3 Steps involved in it

Get step-by-step solutions from verified subject matter experts