

Question: CVS (CVS) Sample Financial Data Selected Income Statement Data 1/31/2022 Sales $ 292,111 Cast of Goods sold 175,800 Selling General Administrative Expense 103, 115 Earnings
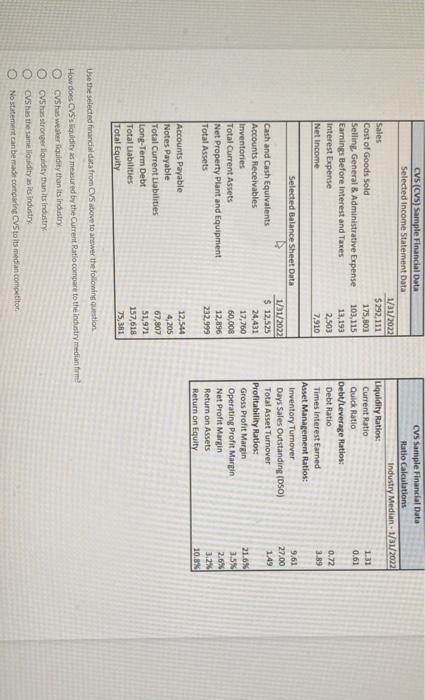
CVS (CVS) Sample Financial Data Selected Income Statement Data 1/31/2022 Sales $ 292,111 Cast of Goods sold 175,800 Selling General Administrative Expense 103, 115 Earnings Before interest and Taxes 13,193 Interest Expense 2,503 Net Income 7,910 CVs Sample Financial Data Ratio Calculations Industry Medin. 1/31/2022 Liquidity Ratios: Current Ratio 1:31 Quick Ratio 0.61 Debt/Leverage Ratios: Debt Ratio 0.22 Times Interest Earned 3.89 Asset Management Ratios: Inventory Turnover 9,61 Days Sales Outstanding (OSO) 27.00 Total Asset Turnover 1.49 Profitability Ratios: Gross Profit margin 21.6% Operating Profit Margin 3.5% Net Profit margin 2.6% Return on Assets 3.2 Return on Equity 10.8% Selected Balance Sheet Data Cash and Cash Equivalents Accounts Receivables Inventories Total Current Assets Net Property Plant and Equipment Total Assets 1/31/2022 $ 12,525 24,431 17,760 60,008 12.896 232,999 Accounts Payable Notes Payable Total Current Liabilities Long-Term Debt Total Liabilities Total Equity 12,544 4,205 67,807 51,971 157,618 75,381 Use the selected financial data from CVS above to answer the following question How does CVS's uidity measured by the Current Ratio compare to the industry median firme CVS has weaker Siquidity than its industry, CVS has stronger luidity tunits industry. CVS has the same louidity as its industry No statement can be made comparing CVS to its median competitor
Step by Step Solution
There are 3 Steps involved in it

Get step-by-step solutions from verified subject matter experts