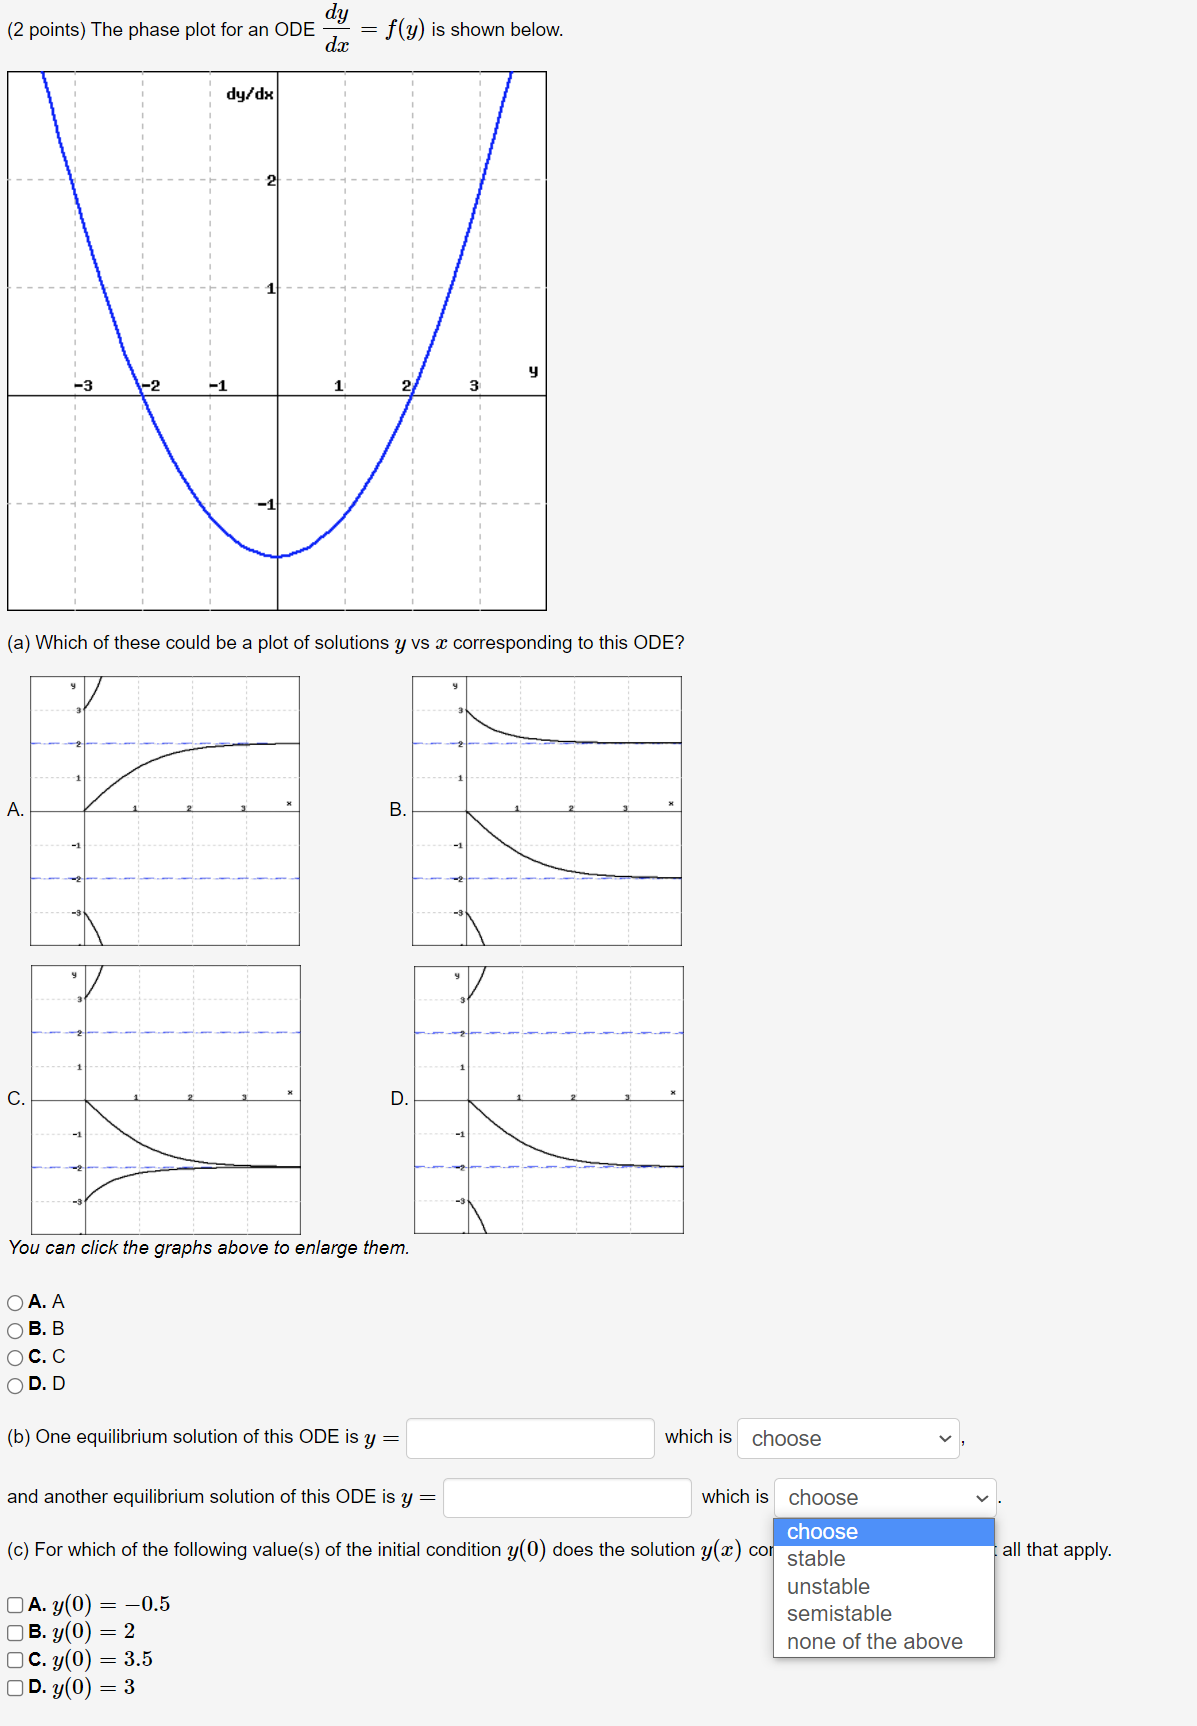
Question: d (2 points) The phase plot for an ODE i = y) is shown below. (a) Which of these oould be a plot of solutions

d (2 points) The phase plot for an ODE i = y) is
d (2 points) The phase plot for an ODE i = y) is shown below. (a) Which of these oould be a plot of solutions 3; vs a: corresponding to this ODE? You can click the graphs above to enlarge them. O A. A O s. s o c. C O D. D (b) One equilibrium solution of this ODE is y = which is choose v , and another equilibrium solution of this ODE is y : which is choose v . choose I (c) For which of the following value(s) of the initial condition y(0) does the solution y(a:) co stable all that apply. unstable DA' 9(0) 2 _0'5 semistable [3 3' 9(0) 2 2 none of the above [3 c. y(0) = 3.5 [:lD. y(0) : 3

Step by Step Solution

There are 3 Steps involved in it

1 Expert Approved Answer
Step: 1 Unlock blur-text-image
Question Has Been Solved by an Expert!

Get step-by-step solutions from verified subject matter experts

Step: 2 Unlock
Step: 3 Unlock

Students Have Also Explored These Related Mathematics Questions!