

Question: d. Find the p-value. C] e. Decide: Ho f. Conclusion: At a = 0.15 significance level, there it enough evidence to conclude that more than
![d. Find the p-value. C] e. Decide: Ho f. Conclusion: At](https://dsd5zvtm8ll6.cloudfront.net/si.experts.images/questions/2024/10/6708b1e53762b_0776708b1e525381.jpg)
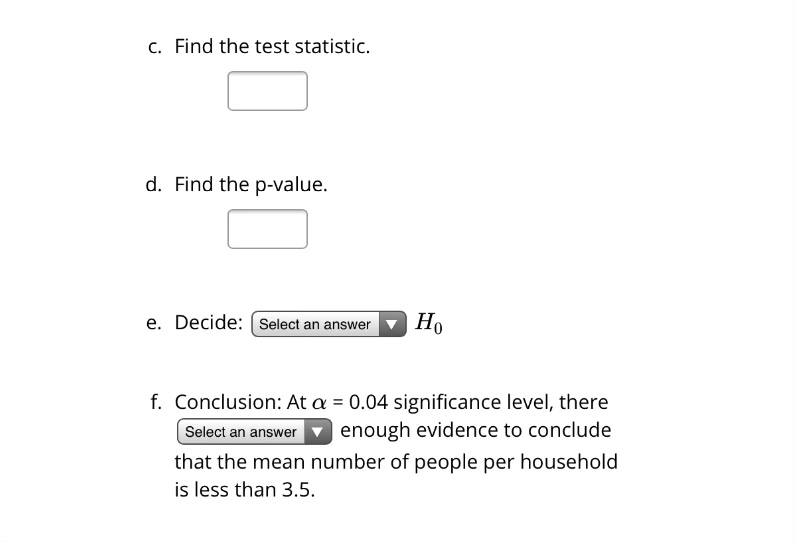
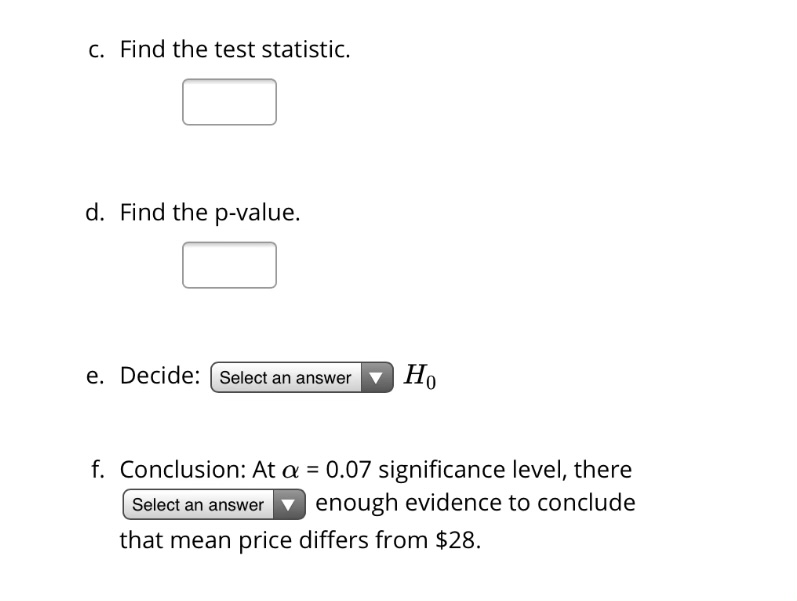
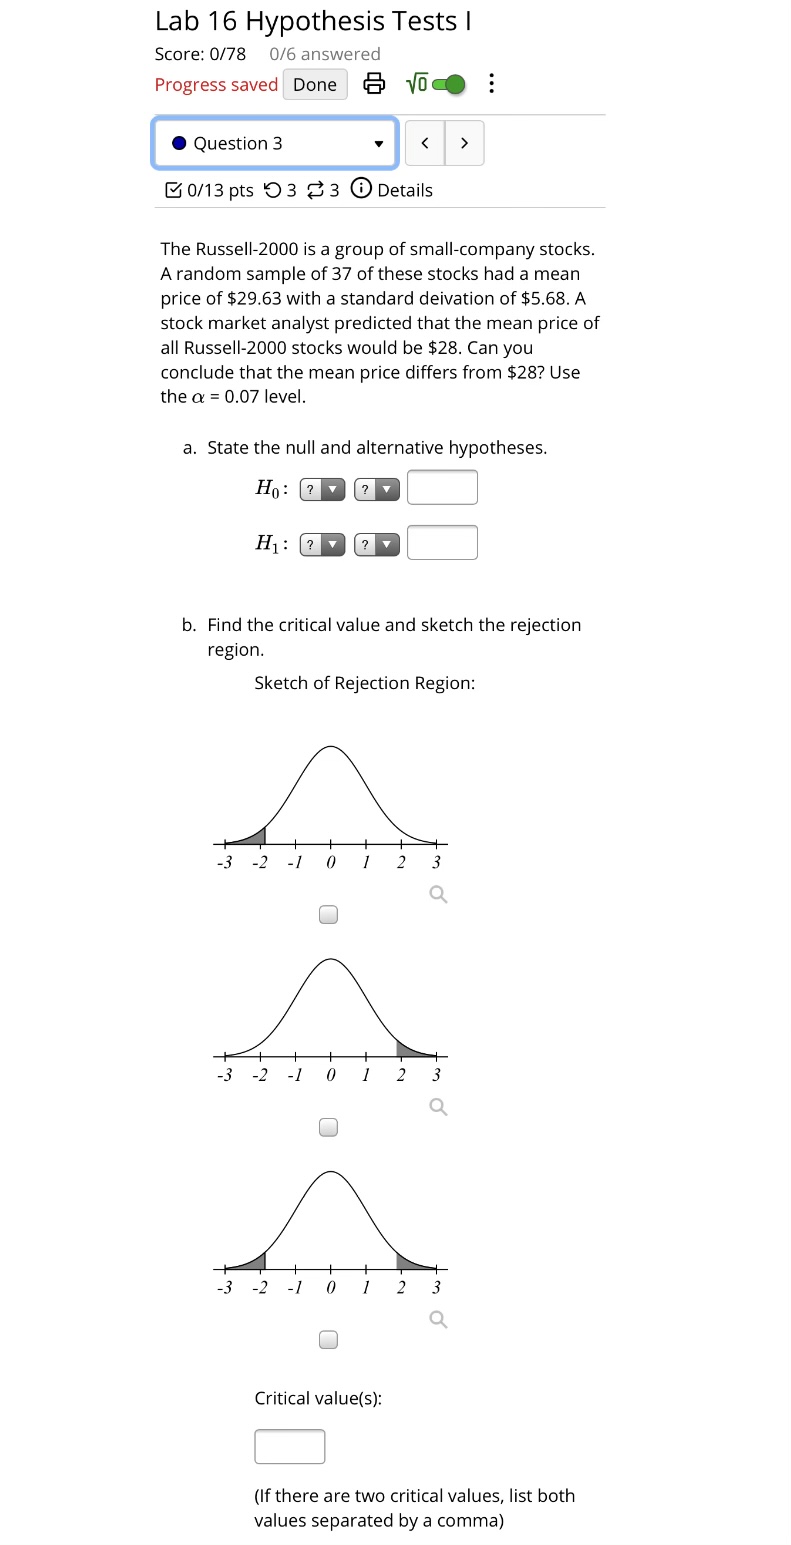
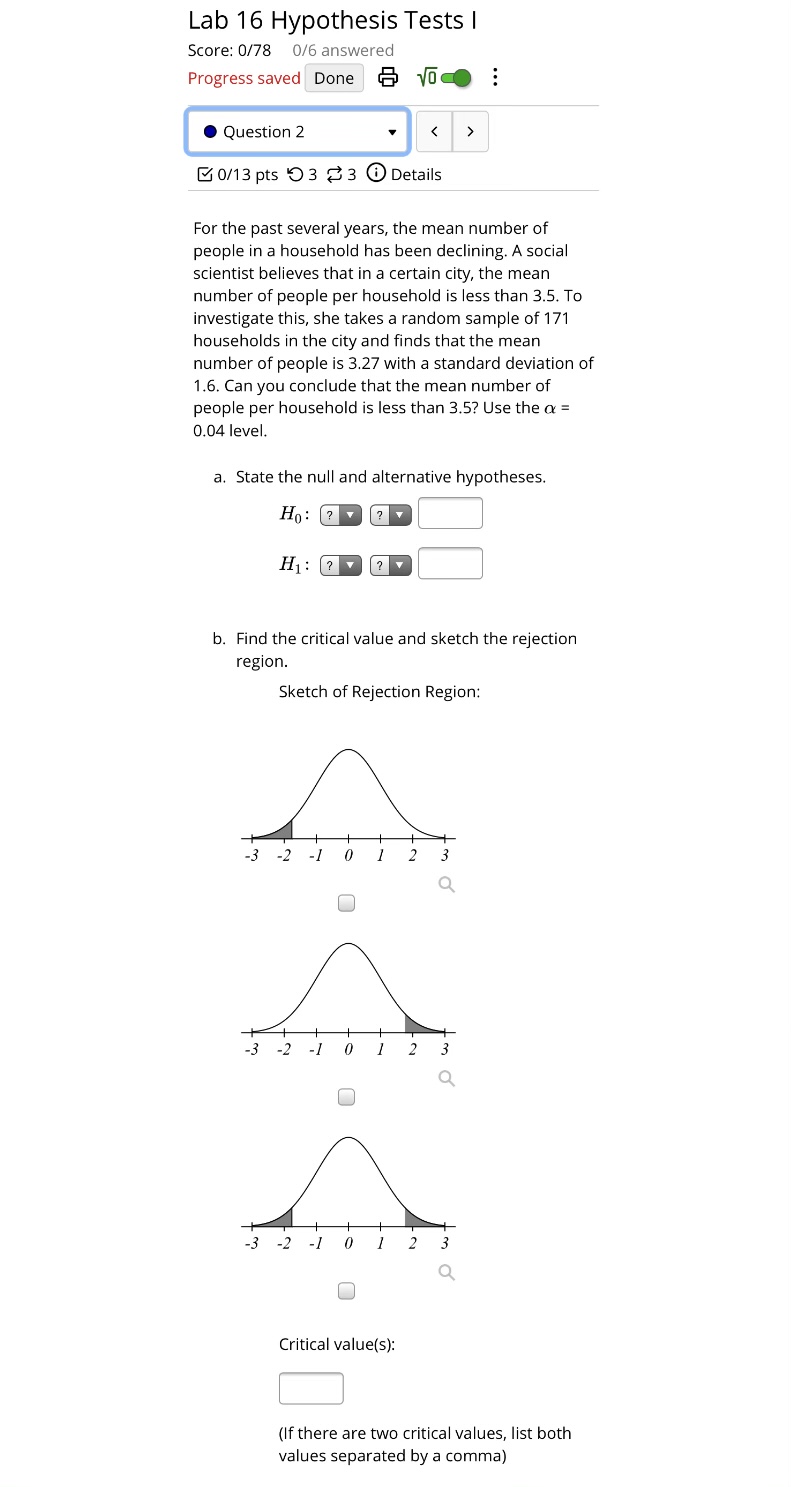
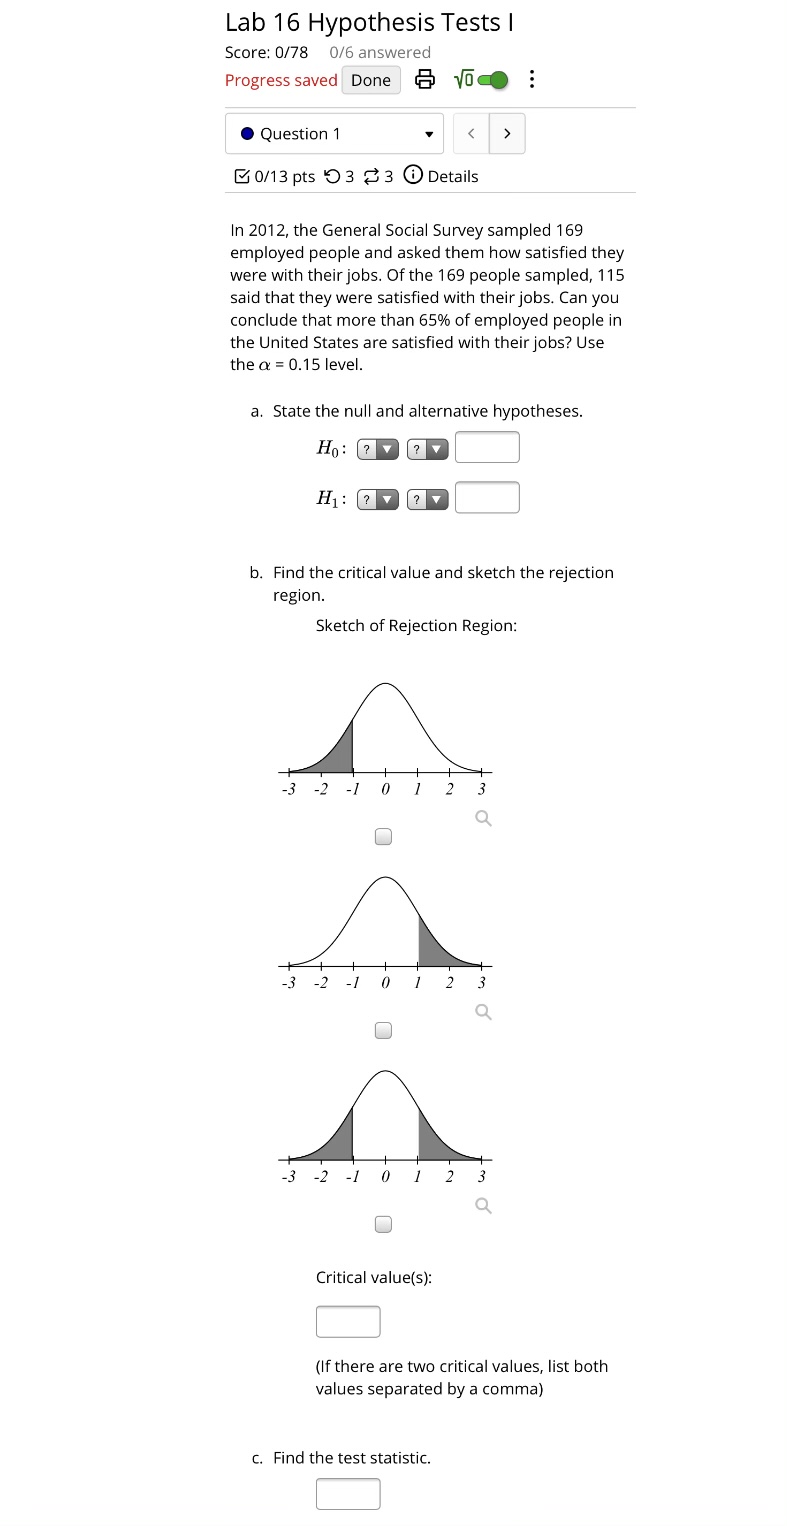
d. Find the p-value. C] e. Decide: Ho f. Conclusion: At a = 0.15 significance level, there it enough evidence to conclude that more than 65% of employed people in the United States are satisfied with their jobs. c. Find the test statistic. d. Find the p-value. e. Decide: Select an answer V Ho f. Conclusion: At a = 0.04 significance level, there Select an answer D enough evidence to conclude that the mean number of people per household is less than 3.5.c. Find the test statistic. d. Find the p-value. e. Decide: Select an answer Ho f. Conclusion: At a = 0.07 significance level, there Select an answer enough evidence to conclude that mean price differs from $28.Lab 16 Hypothesis Tests I Score: 0!?8 0.16 answered Progresssaved Done IE! {6' E 0 Question 3 v 80:13 pts 03 83 @oetails The Russall2000 is a group of smallcompany stocks. A random sample of 37 of these stocks had a mean price of $29.63 with a standard deivation of $5.68. A stock market analyst predicted that the mean price of all Russell-2000 stocks would be $28. Can you conclude that the mean price differs from $28? Use the or = 0.07 level. a. State the null and alternative hypotheses. b. Find the critical value and sketch the rejection region. Sketch of Rejection Region: -3-210;23 q [3 -3-210123 Q 32IOI23 C] Critical value(s): [3 (If there are two critical values, list both values separated by a comma} Lab 16 Hypothesis Tests | Score: 0/78 0/6 answered Progress saved Done & Voce . . . . Question 2 0/13 pts 3 2 3 0 Details For the past several years, the mean number of people in a household has been declining. A social scientist believes that in a certain city, the mean number of people per household is less than 3.5. To investigate this, she takes a random sample of 171 households in the city and finds that the mean number of people is 3.27 with a standard deviation of 1.6. Can you conclude that the mean number of people per household is less than 3.5? Use the a = 0.04 level. a. State the null and alternative hypotheses. Ho : ? ? H1 : ? Y ? Y b. Find the critical value and sketch the rejection region. Sketch of Rejection Region: -3 0 2 W Q O 0 2 W Q W Q O Critical value(s): (If there are two critical values, list both values separated by a comma)Lab 16 Hypothesis Tests | Score: 0/78 0/6 answered Progress saved Done & Voce . . . . Question 1 0/13 pts 9 3 2 3 0 Details In 2012, the General Social Survey sampled 169 employed people and asked them how satisfied they were with their jobs. Of the 169 people sampled, 115 said that they were satisfied with their jobs. Can you conclude that more than 65% of employed people in the United States are satisfied with their jobs? Use the a = 0.15 level. a. State the null and alternative hypotheses. Ho: ? Y ? Y H1: ? Y ? Y b. Find the critical value and sketch the rejection region. Sketch of Rejection Region: -3 -2 -1 0 3 Q 2 w Q O -3 -2 - -1 0 Q O Critical value(s): (If there are two critical values, list both values separated by a comma) c. Find the test statistic
Step by Step Solution
There are 3 Steps involved in it

Get step-by-step solutions from verified subject matter experts