

Question: c. Find the test statistic. S d. Find the p-value. S e. Decide: Ho f. Conclusion: At or = 0.01 significance level. there enough evidence
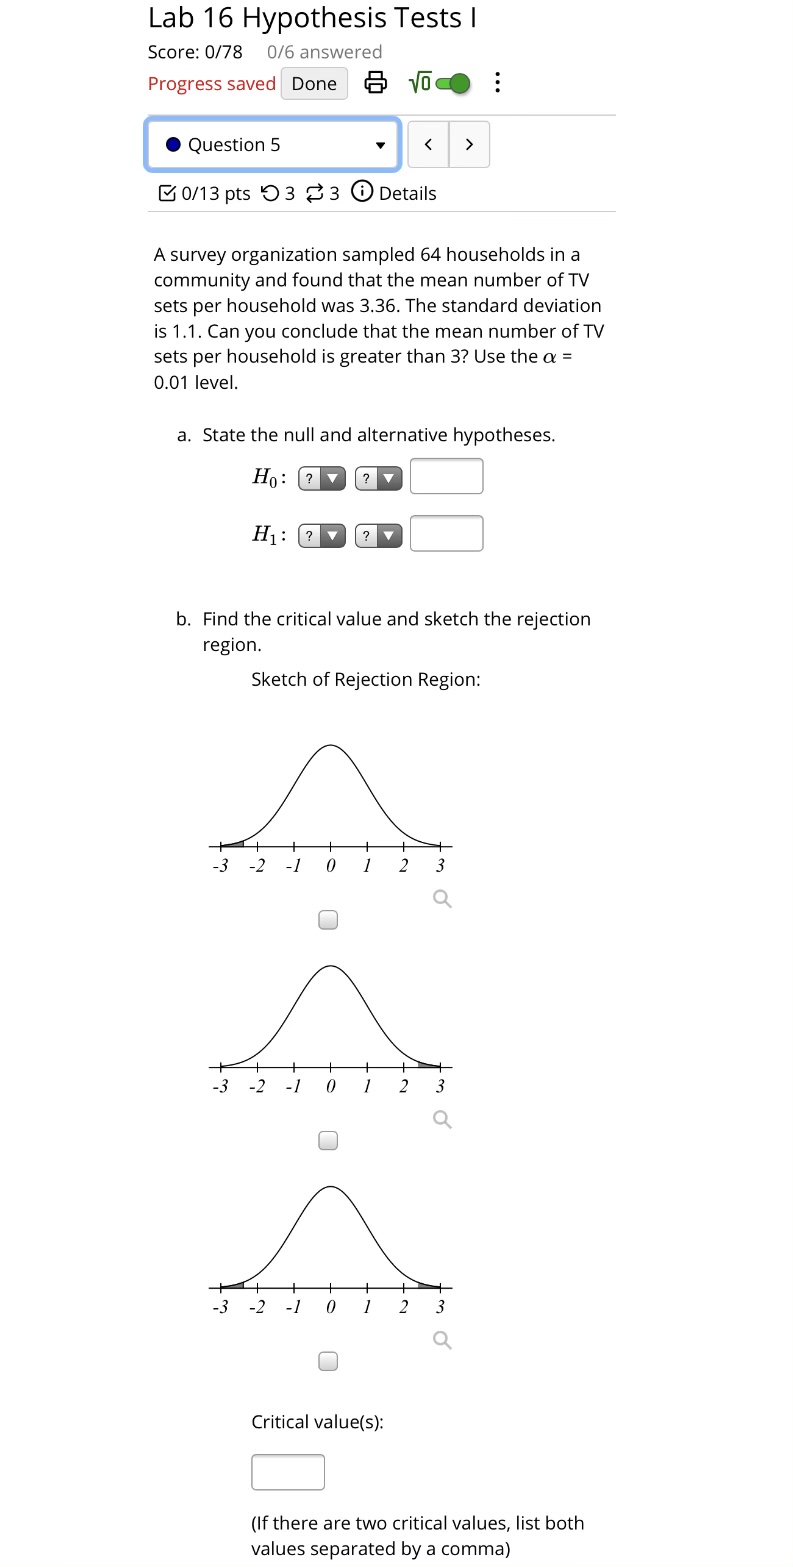
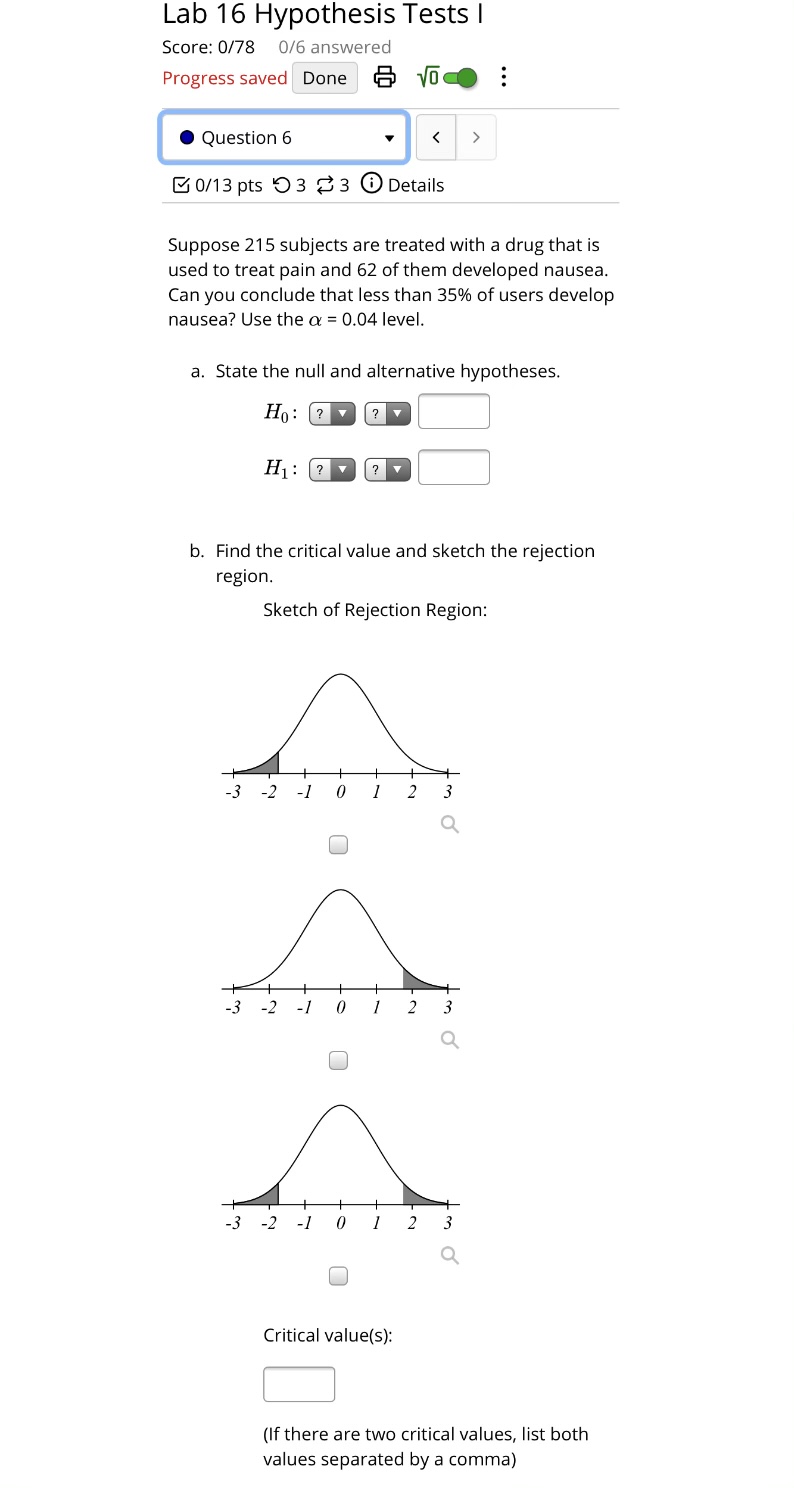
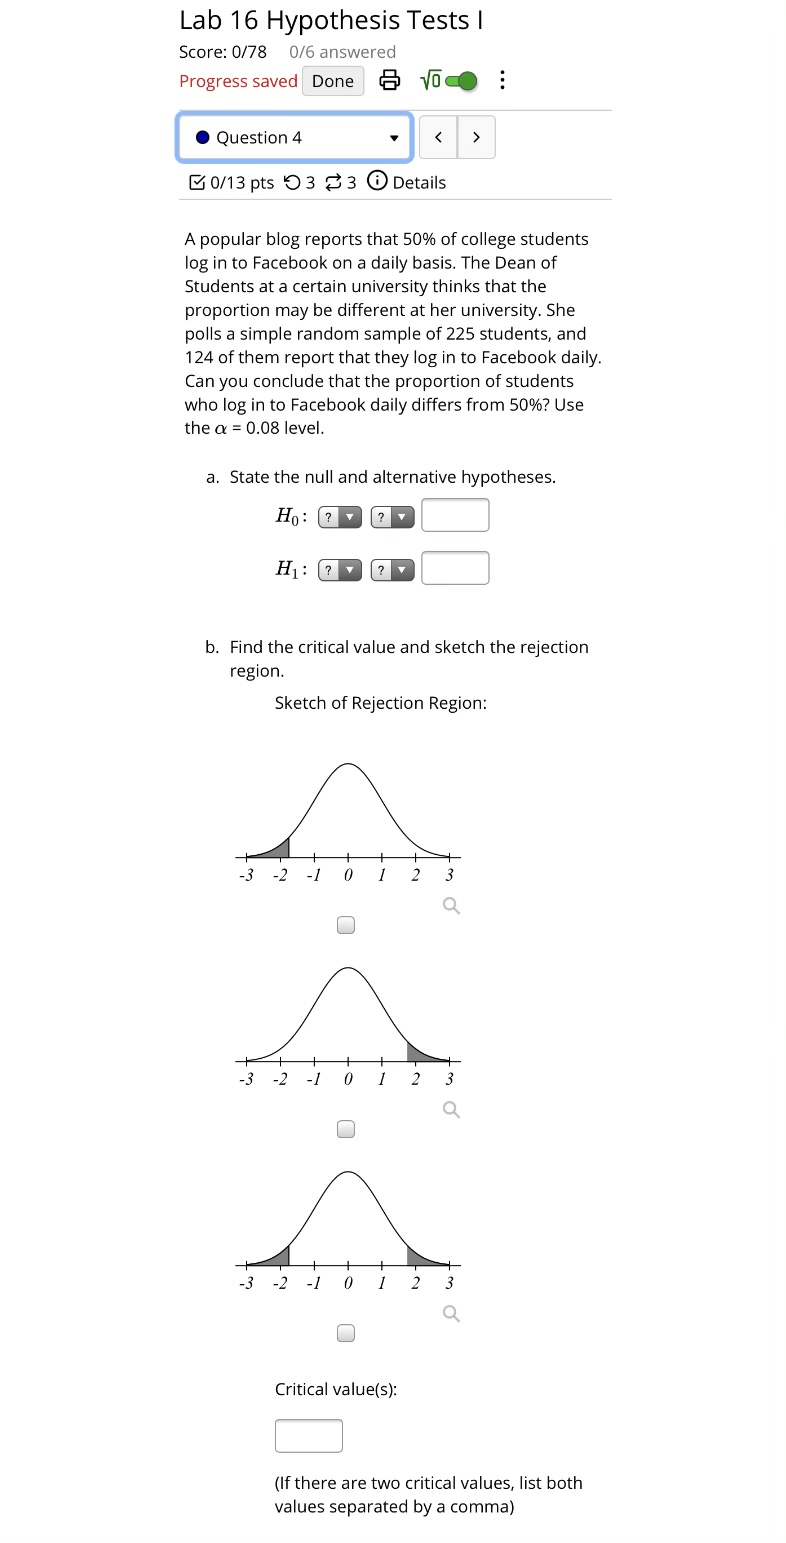
c. Find the test statistic. S d. Find the p-value. S e. Decide: Ho f. Conclusion: At or = 0.01 significance level. there enough evidence to conclude that the mean number ofTV sets per household is greater than 3. Lab 16 Hypothesis Tests | Score: OHS Ufa answered ProgresssavedIDone 6 {5' E "i 0 Question 5 v ( > Bonapts '03 33 Game A survey organization sampled 64 households in a community and found that the mean number ofTV sets per household was 3.36. The standard deviation is 1.1. Can you conclude that the mean number ofTV sets per household is greater than 3? Use the a = 0.01 level. a. State the null and alternative hypotheses. marina b. Find the critical value and sketch the rejection region. Sketch of Rejection Region: Critical valuets}: I: (If there are two critical values, list both values separated by a comma) Lab 16 Hypothesis Tests | Score: 0378 Off?) answered Progress saved [June a {5' E 0 Question 6 v EI'U/13pt5 '03 :33 @oetails Suppose 215 subjects are treated with a drug that is used to treat pain and 62 of them developed nausea. Can you conclude that less than 35% of users develop nausea? Use the o: = 0.04 level. a. State the null and alternative hypotheses. b. Find the critical value and sketch the rejection region. Sketch of Rejection Region: 3210}23 q [:1 -3-2-;0.r23 Q [3 Ill 3-240123 q C] Critical value{s): [:1 (If there are two critical values, list both values separated by a comma} c. Find the test statistic. d. Find the p-value. e. Decide: Select an answer V Ho f. Conclusion: At a = 0.04 significance level, there Select an answer enough evidence to conclude that less than 35% of users develop nausea.c. Find the test statistic. i: d. Find the p-value. [:i e. Decide: Ho f. Conclusion: At a = 0.03 significance level, there v enough evidence to conclude that the proportion of students who log in to Facebook daily differs from 50%. Lab 16 Hypothesis Tests | Score: 0/78 0/6 answered Progress saved Done . . . . Question 4 0/13 pts 93 3 0 Details A popular blog reports that 50% of college students log in to Facebook on a daily basis. The Dean of Students at a certain university thinks that the proportion may be different at her university. She polls a simple random sample of 225 students, and 124 of them report that they log in to Facebook daily. Can you conclude that the proportion of students who log in to Facebook daily differs from 50%? Use the a = 0.08 level. a. State the null and alternative hypotheses. Ho : ? " ? Y H 1 : ? Y ? Y b. Find the critical value and sketch the rejection region. Sketch of Rejection Region: -3 -2 0 Q O -3 -2 0 2 3 Q O -2 2 Q O Critical value(S): (If there are two critical values, list both values separated by a comma)
Step by Step Solution
There are 3 Steps involved in it

Get step-by-step solutions from verified subject matter experts