

Question: d. Motivated by the squeeze theorem, on the same graph (hold on) plot both 3; = |:r| and y = |:c| (|:c| is abs (x)
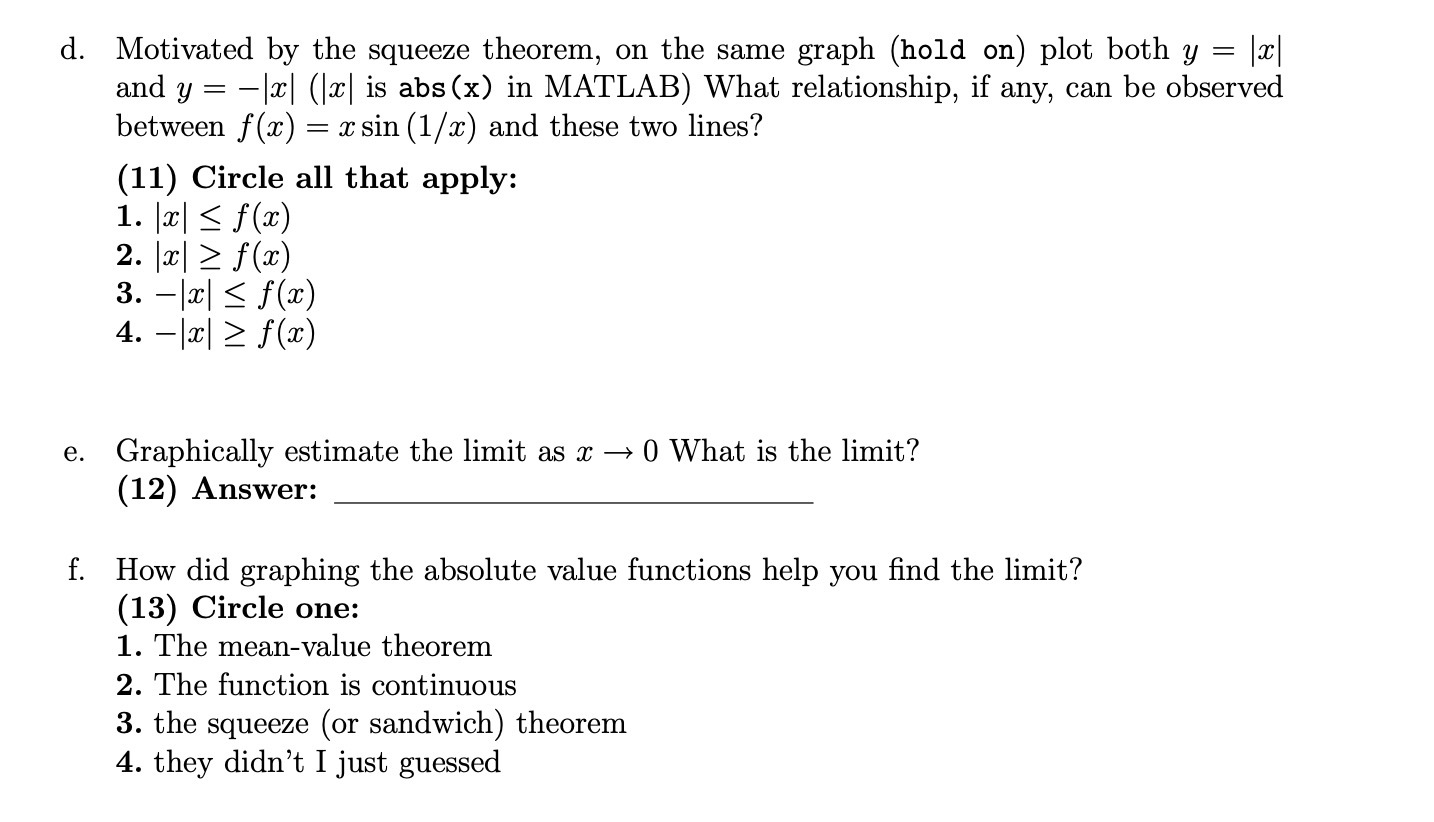
d. Motivated by the squeeze theorem, on the same graph (hold on) plot both 3; = |:r| and y = |:c| (|:c| is abs (x) in MATLAB) What relationship, if any, can be observed between f (:c) = resin (1 / cc) and these two lines? (11) Circle all that apply: 1 2. 3. |3:| 4. e. Graphically estimate the limit as m > 0 What is the limit? (12) Answer: f. How did graphing the absolute value functions help you nd the limit? (13) Circle one: 1. The meanvalue theorem 2. The function is continuous 3. the squeeze (or sandwich) theorem 4. they didn't I just guessed
Step by Step Solution
There are 3 Steps involved in it
1 Expert Approved Answer
Step: 1 Unlock

Question Has Been Solved by an Expert!
Get step-by-step solutions from verified subject matter experts
Step: 2 Unlock
Step: 3 Unlock