

Question: d. On the graph, clearly label the areas representing consumer and producer surplus with trade. Then complete the table below by calculating each. Once again,
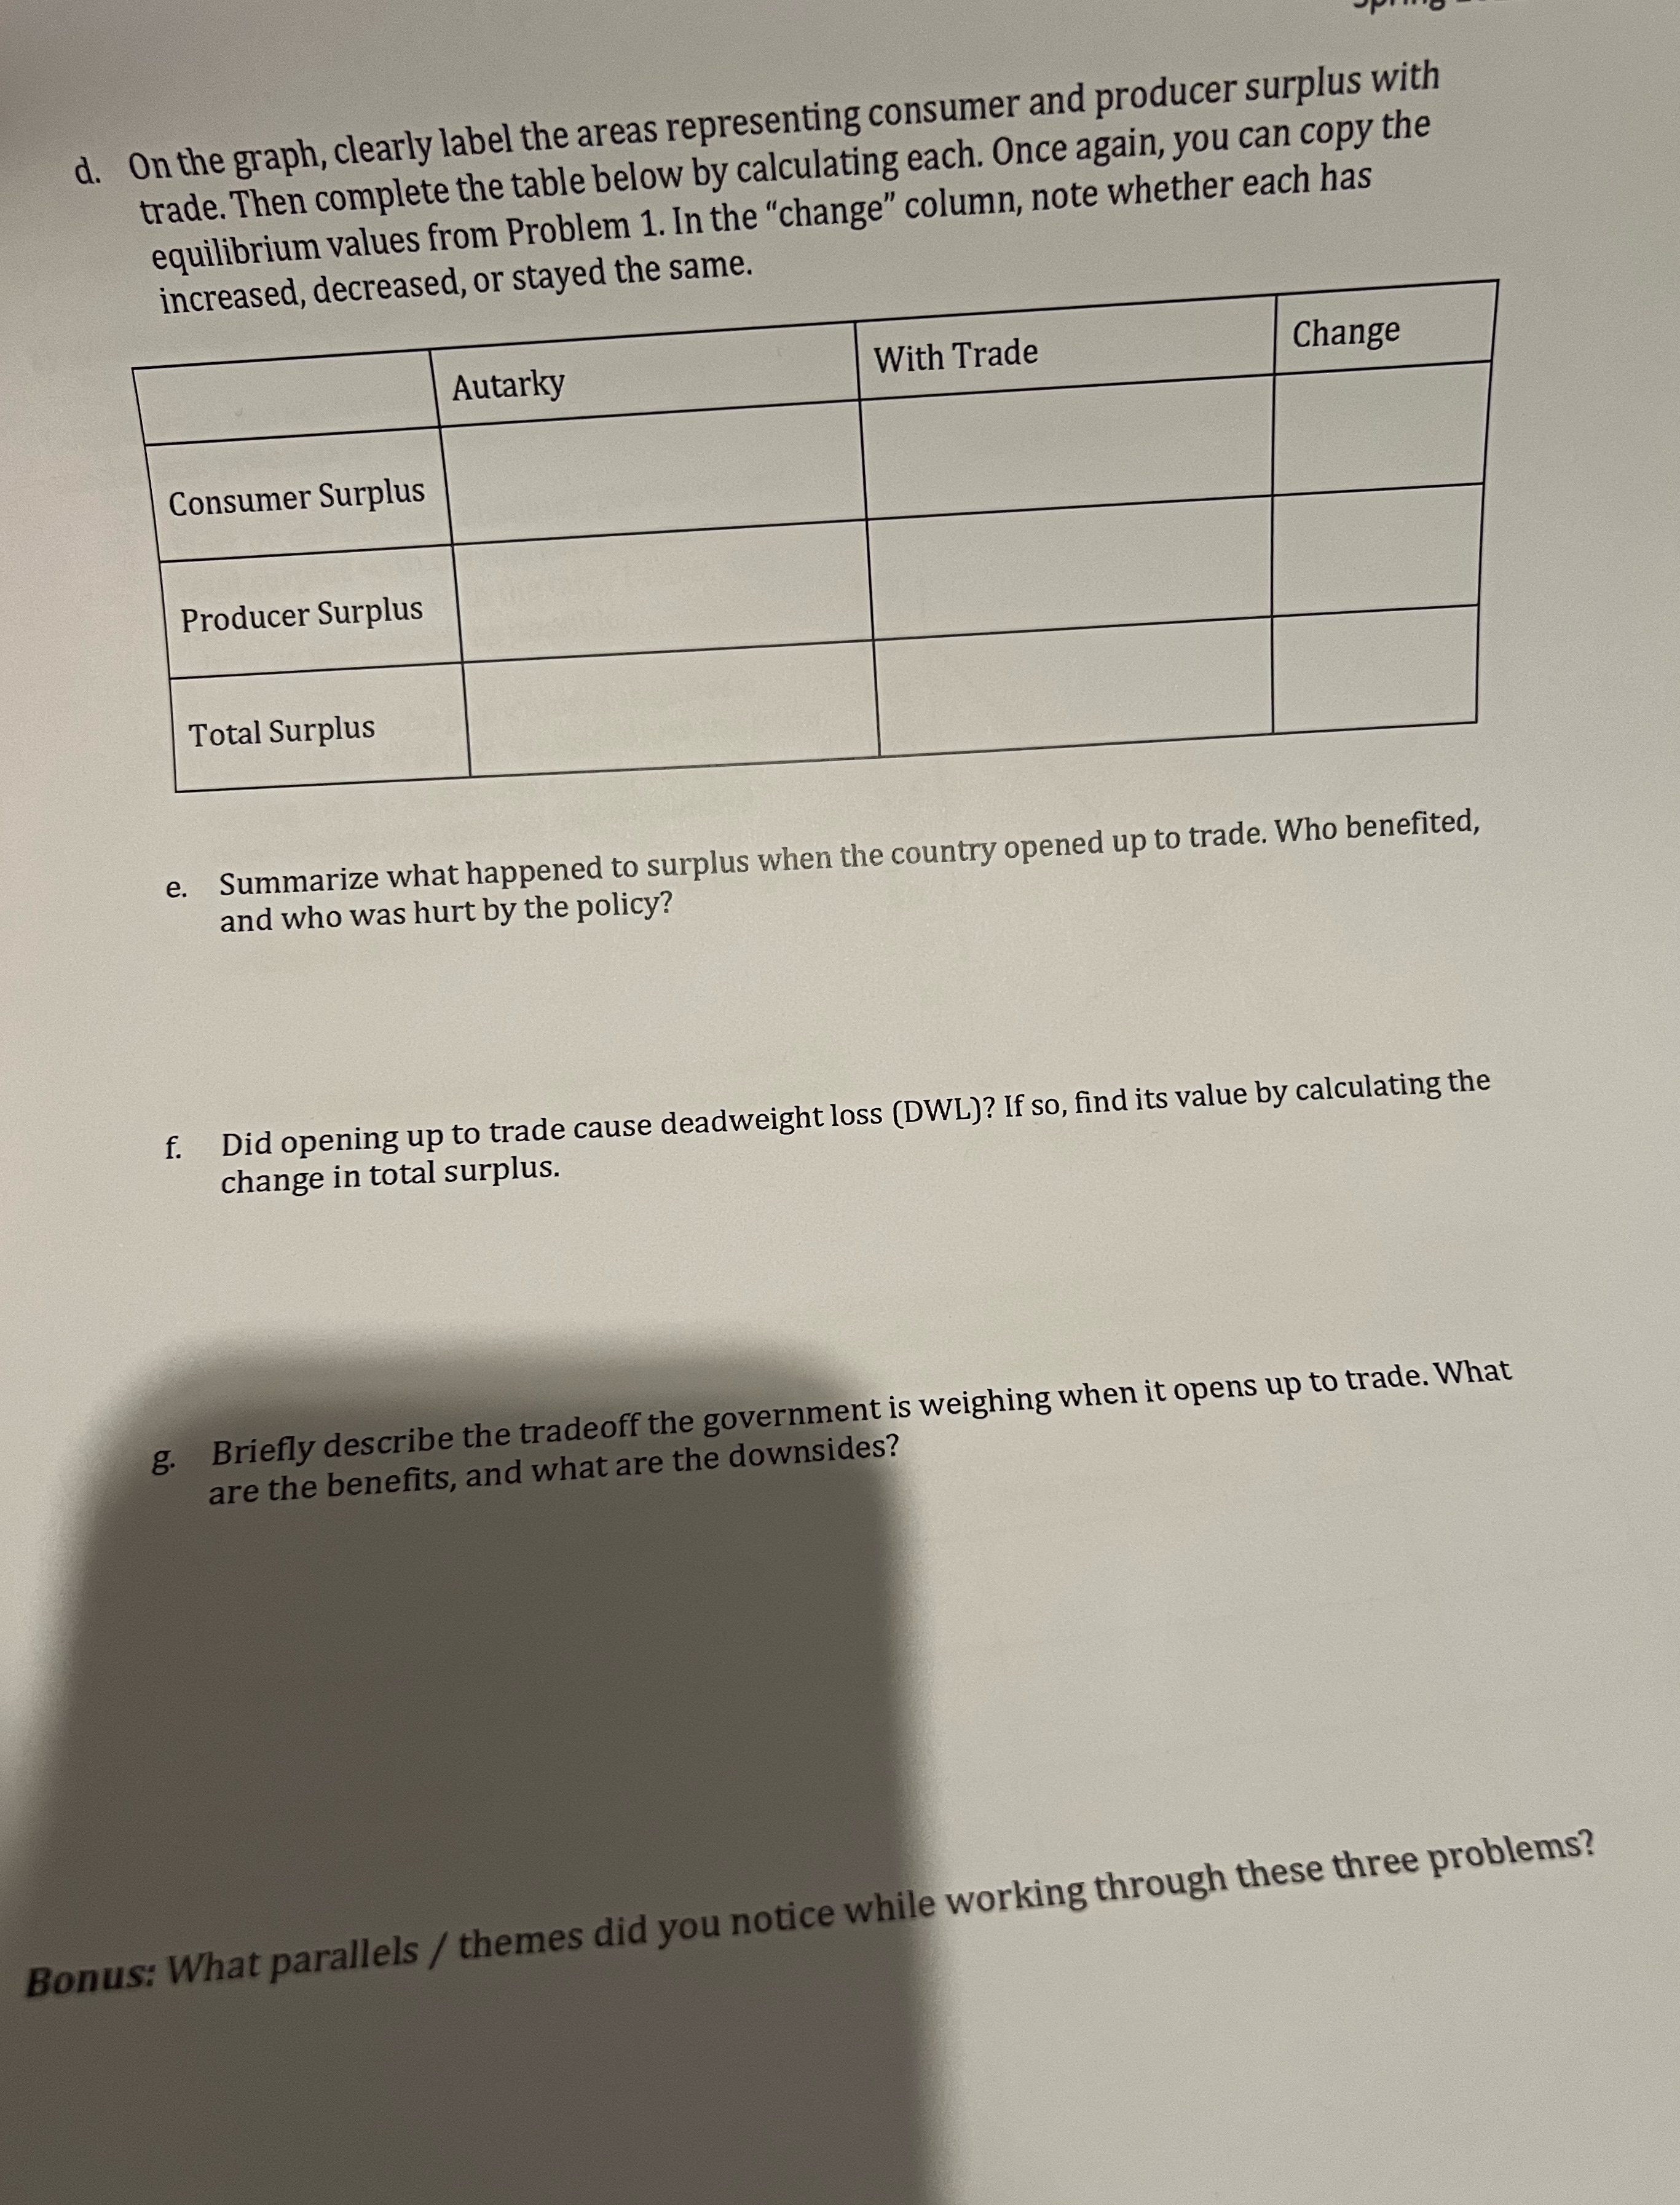
d. On the graph, clearly label the areas representing consumer and producer surplus with trade. Then complete the table below by calculating each. Once again, you can copy the equilibrium values from Problem 1. In the "change" column, note whether each has increased, decreased, or stayed the same. Autarky With Trade Change Consumer Surplus Producer Surplus Total Surplus 2. Summarize what happened to surplus when the country opened up to trade. Who benefited, and who was hurt by the policy? f. Did opening up to trade cause deadweight loss (DWL)? If so, find its value by calculating the change in total surplus. g. Briefly describe the tradeoff the government is weighing when it opens up to trade. What are the benefits, and what are the downsides? Bonus: What parallels / themes did you notice while working through these three problems
Step by Step Solution
There are 3 Steps involved in it

Get step-by-step solutions from verified subject matter experts