

Question: d . Plot the Security Market Line. Select the correct graph. The correct graph is A B . C . e . Suppose you hold
d Plot the Security Market Line.
Select the correct graph.
The correct graph is
A
B
C
e Suppose you hold a large, welldiversified portfolio and are considering adding to that portfolio either Stock or another stock,
Stock which has the same beta as Stock but a higher standard deviation of returns. Stocks and have the same expected
returns:
hat
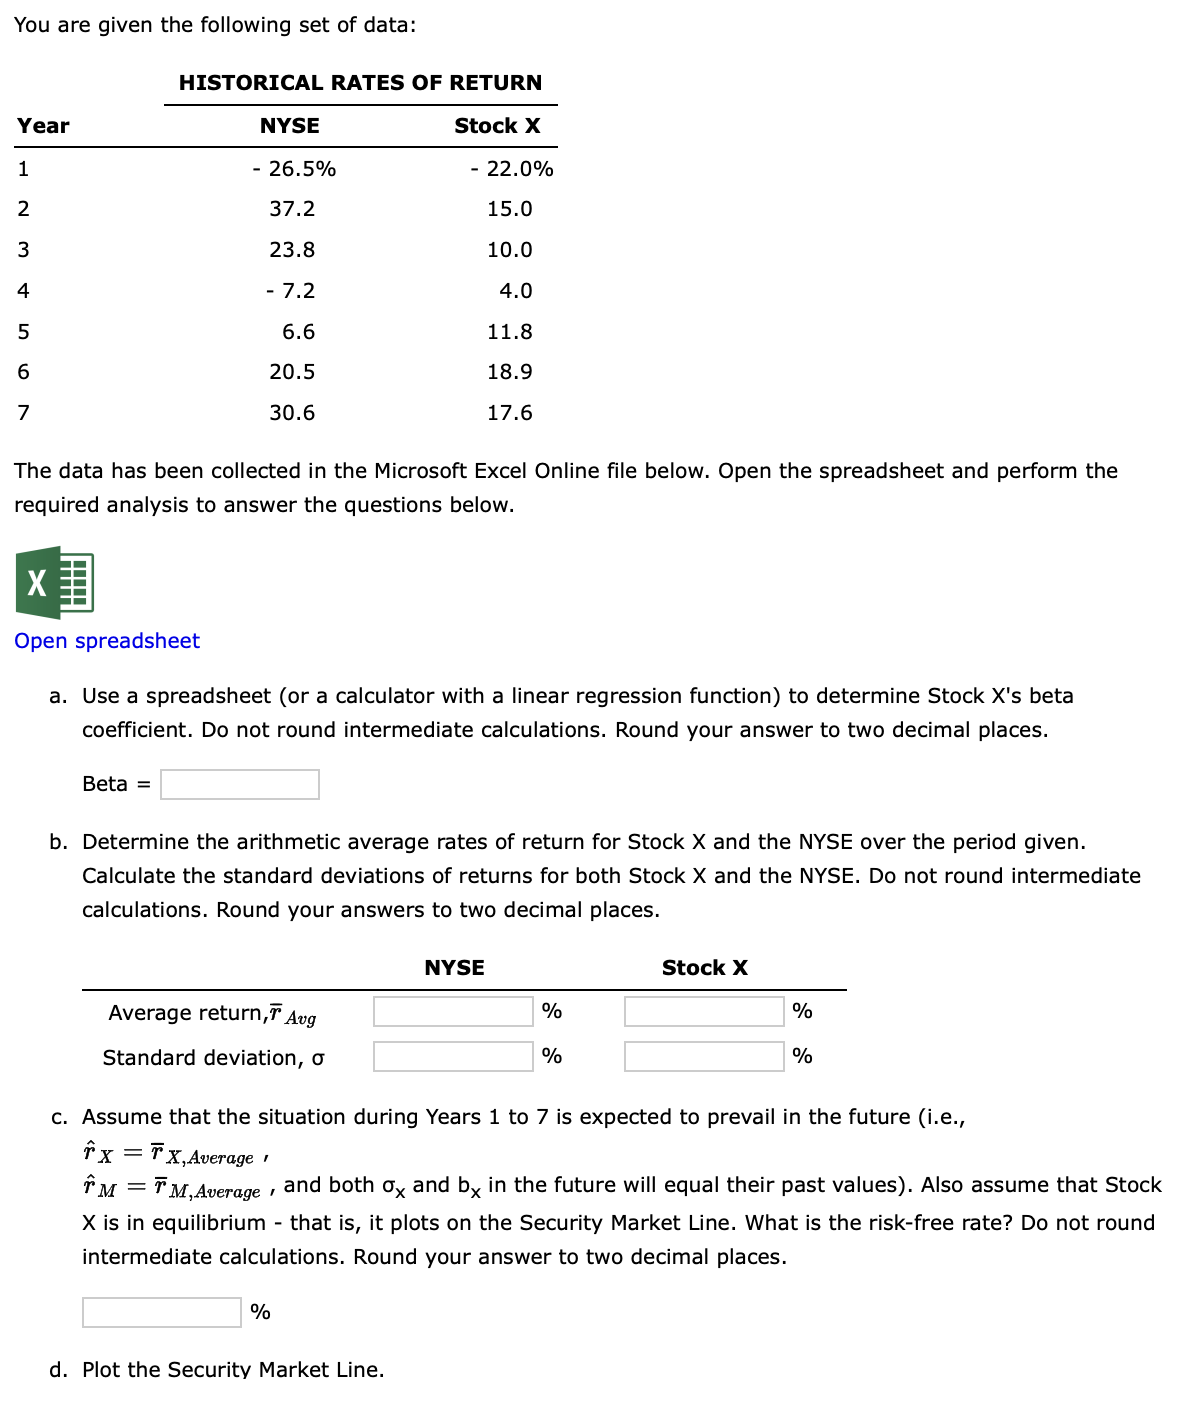
hat Which stock should you choose?You are given the following set of data:
HISTORICAL RATES OF RETURN
The data has been collected in the Microsoft Excel Online file below. Open the spreadsheet and perform the
required analysis to answer the questions below.
Open spreadsheet
a Use a spreadsheet or a calculator with a linear regression function to determine Stock Xs beta
coefficient. Do not round intermediate calculations. Round your answer to two decimal places.
Beta
b Determine the arithmetic average rates of return for Stock and the NYSE over the period given.
Calculate the standard deviations of returns for both Stock and the NYSE. Do not round intermediate
calculations. Round your answers to two decimal places.
NYSE
Average return,
Standard deviation,
Stock X
c Assume that the situation during Years to is expected to prevail in the future ie
hat
hat and both and in the future will equal their past values Also assume that Stock
X is in equilibrium that is it plots on the Security Market Line. What is the riskfree rate? Do not round
intermediate calculations. Round your answer to two decimal places.
d Plot the Security Market Line.
Step by Step Solution
There are 3 Steps involved in it
1 Expert Approved Answer
Step: 1 Unlock

Question Has Been Solved by an Expert!
Get step-by-step solutions from verified subject matter experts
Step: 2 Unlock
Step: 3 Unlock