

Question: d. Plot the Security Market Line. e. Suppose you hold a large, well-diversified portfolio and are considering adding to that portfolio either Stock X or
d. Plot the Security Market Line. e. Suppose you hold a large, well-diversified portfolio and are considering
adding to that portfolio either Stock X or another stock, Stock Y, which has the same beta as Stock X but a higher standard deviation of returns. Stocks X and Y have the same expected returns: rX 5 rY 5 10.6%. Which stock should you choose?
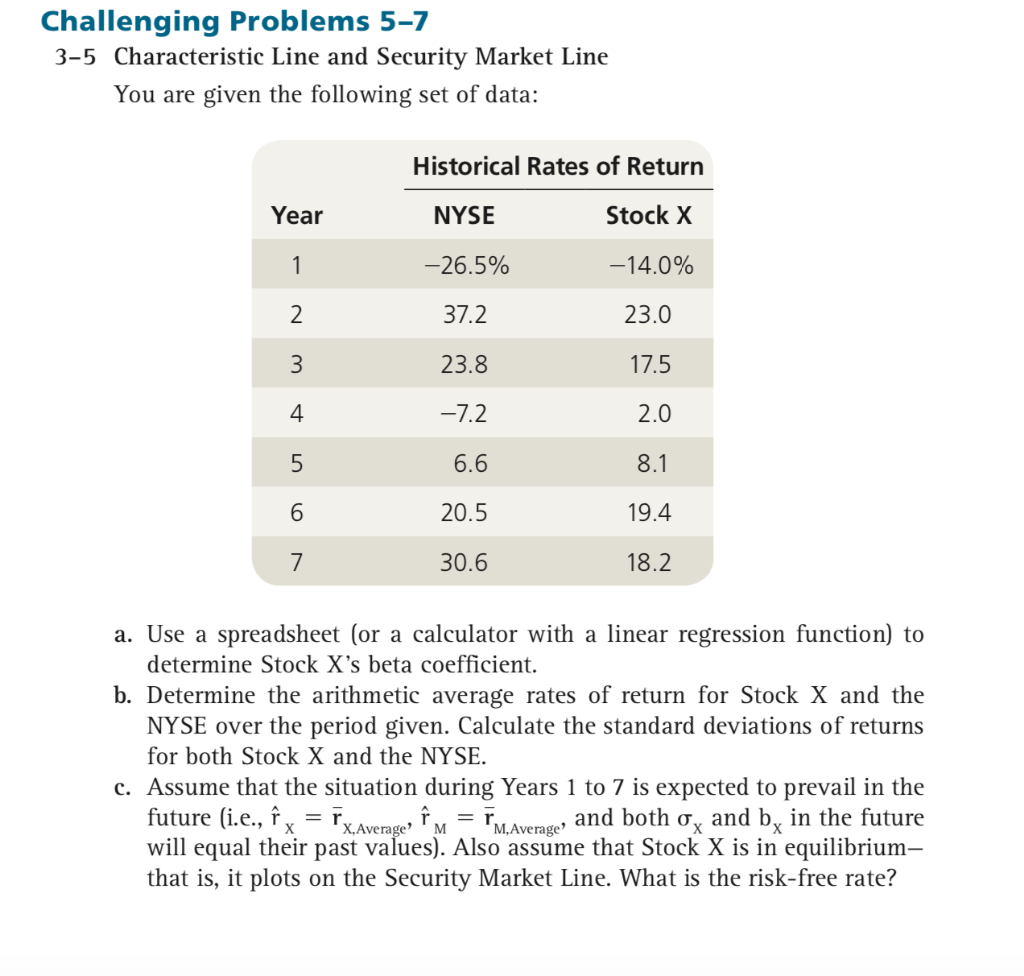
Challenging Problems 5-7 3-5 Characteristic Line and Security Market Line You are given the following set of data: Historical Rates of Return Year NYSE Stock X -26.5% -14.0% 37.2 23.8 vou Aw = 23.0 17.5 2.0 -7.2 6.6 8.1 20.5 19.4 30.6 18.2 a. Use a spreadsheet (or a calculator with a linear regression function) to determine Stock X's beta coefficient. b. Determine the arithmetic average rates of return for Stock X and the NYSE over the period given. Calculate the standard deviations of returns for both Stock X and the NYSE. Assume that the situation during Years 1 to 7 is expected to prevail in the future (i.e., f x = Fx Avernor, fv = FM Avenge, and both o, and by in the future will equal their past values). Also assume that Stock X is in equilibrium- that is, it plots on the Security Market Line. What is the risk-free rate
Step by Step Solution
There are 3 Steps involved in it

Get step-by-step solutions from verified subject matter experts