

Question: D Question 11 The figure given below shows the demand curves for five products: A, B, C, D, and E. Figure 6.1 Q Q2 Q3
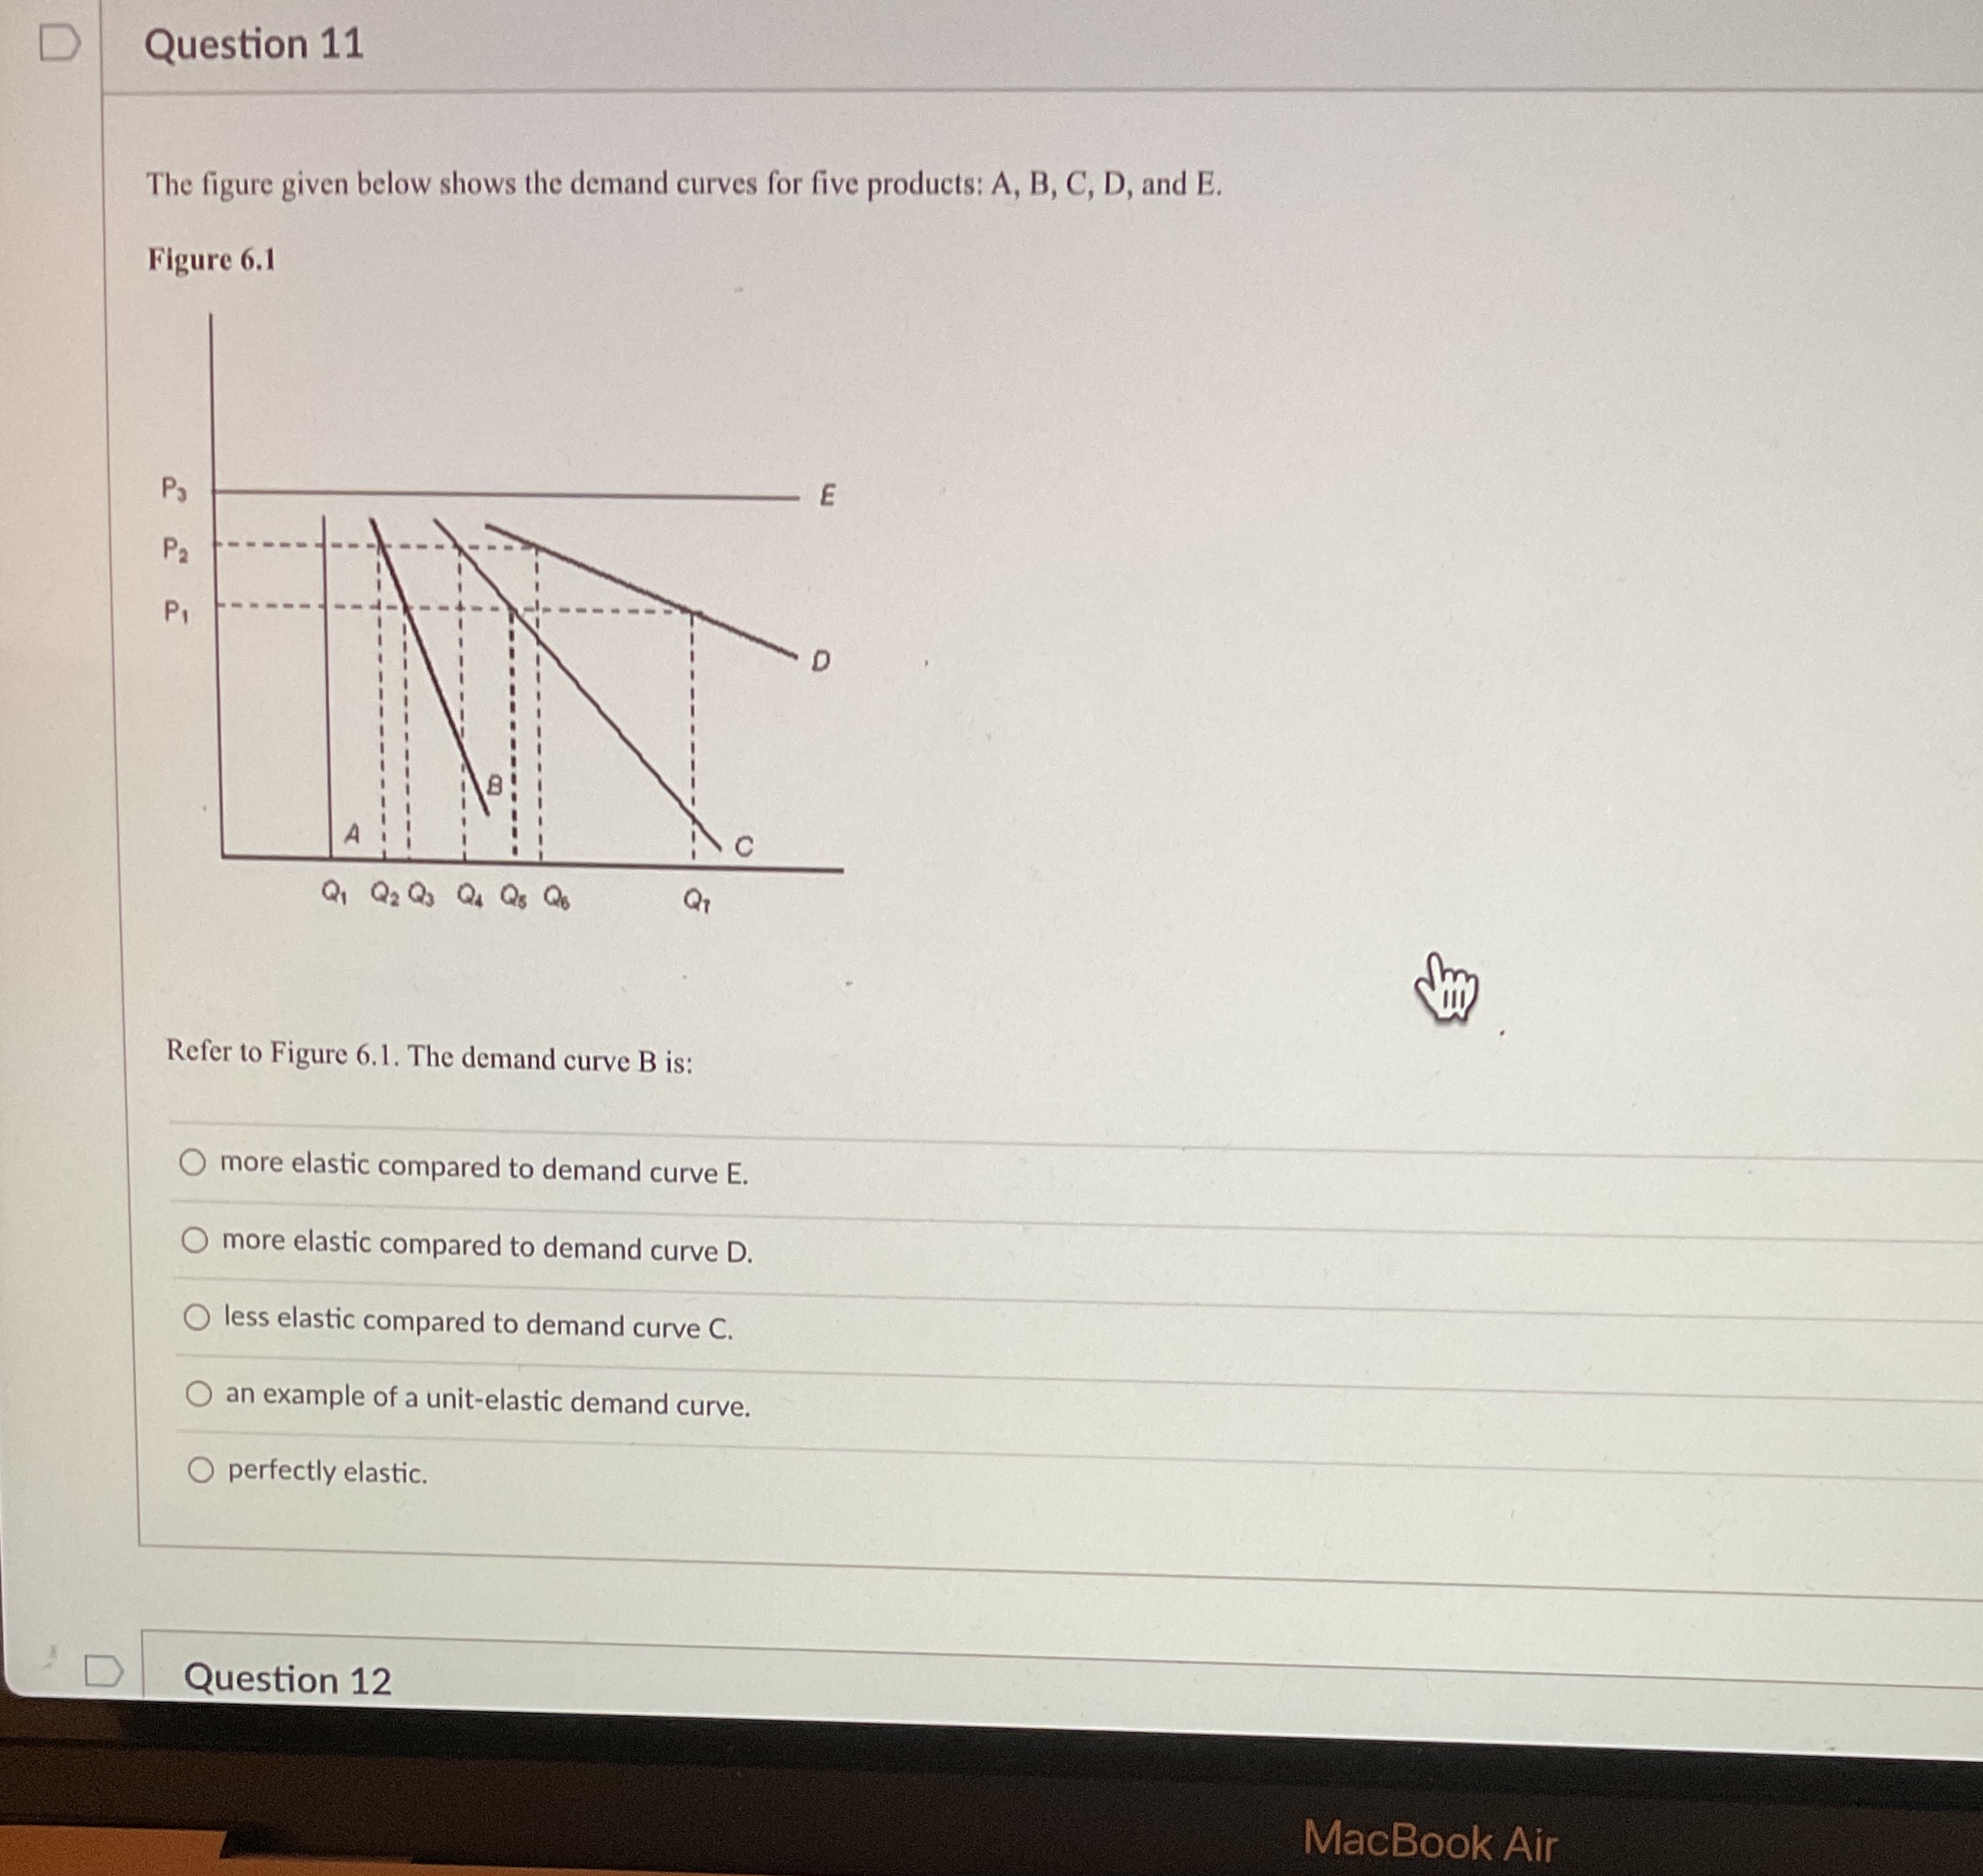
D Question 11 The figure given below shows the demand curves for five products: A, B, C, D, and E. Figure 6.1 Q Q2 Q3 Q4 QB Q Refer to Figure 6.1. The demand curve B is: more elastic compared to demand curve E. more elastic compared to demand curve D. less elastic compared to demand curve C. O an example of a unit-elastic demand curve. O perfectly elastic. D Question 12 MacBook Air
Step by Step Solution
There are 3 Steps involved in it
1 Expert Approved Answer
Step: 1 Unlock

Question Has Been Solved by an Expert!
Get step-by-step solutions from verified subject matter experts
Step: 2 Unlock
Step: 3 Unlock