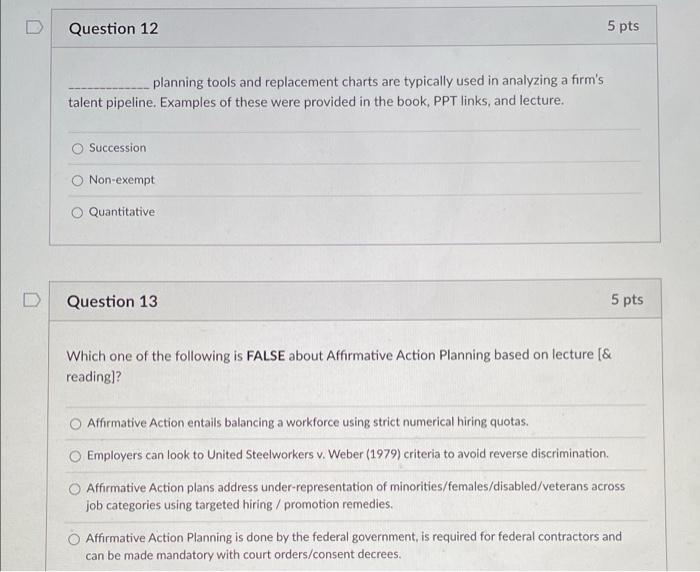
Question: D Question 12 5 pts planning tools and replacement charts are typically used in analyzing a firm's talent pipeline. Examples of these were provided in

D Question 12 5 pts planning tools and
D Question 12 5 pts planning tools and replacement charts are typically used in analyzing a firm's talent pipeline. Examples of these were provided in the book, PPT links, and lecture. Succession O Non-exempt O Quantitative Question 13 5 pts Which one of the following is FALSE about Affirmative Action Planning based on lecture [& reading]? Affirmative Action entails balancing a workforce using strict numerical hiring quotas. Employers can look to United Steelworkers v. Weber (1979) criteria to avoid reverse discrimination. O Affirmative Action plans address under-representation of minorities/females/disabled/veterans across job categories using targeted hiring / promotion remedies. O Affirmative Action Planning is done by the federal government, is required for federal contractors and can be made mandatory with court orders/consent decrees. Question 14 Ratio analysis and Regression analysis are both types of labor O availability; requirements qualitative; requirements Markov; availability statistical; requirements 5 pts tools used to forecast Question 15 5 pts Which is/are consistent with our Ch 3 lecture? O Regression creates a "line of best" fit to historical data, which can be used to predict employee headcount based upon a relevant predictor variable (x), such as Sales. O When using simple regression for HR forecasting (y=mx+b), we're trying to forecast employee headcount, or "y" in the equation. The "m" and "b" in the excel regression output are used to calculate "y". both of these Question 16 5 pts You run a regression in Excel to help you forecast labor requirements, where X (Sales) and Y (Headcount). In the Excel output the slope-.8 and the y-intercept-.5. How many workers would be needed if you expect 7 (million) in sales? [Y is entered in the regression input data in '000s, e.g., 1-1,000] 6,100 5,100 5,600 cannot be determined Question 17 5 pts Consider the following ratio analysis: We know for each 30 customers we need 1 full-time. salesperson. If next year we predict 75 total customers, we'll need how many FTES? 4 FTES O 7.5 5 FTES 2.5 FTES

Step by Step Solution

There are 3 Steps involved in it

1 Expert Approved Answer
Step: 1 Unlock blur-text-image
Question Has Been Solved by an Expert!

Get step-by-step solutions from verified subject matter experts

Step: 2 Unlock
Step: 3 Unlock

Students Have Also Explored These Related General Management Questions!