

Question: D Question 3 1 pts The graph below shows the dependence of the volume of a sphere on its radius. Use this information to extract
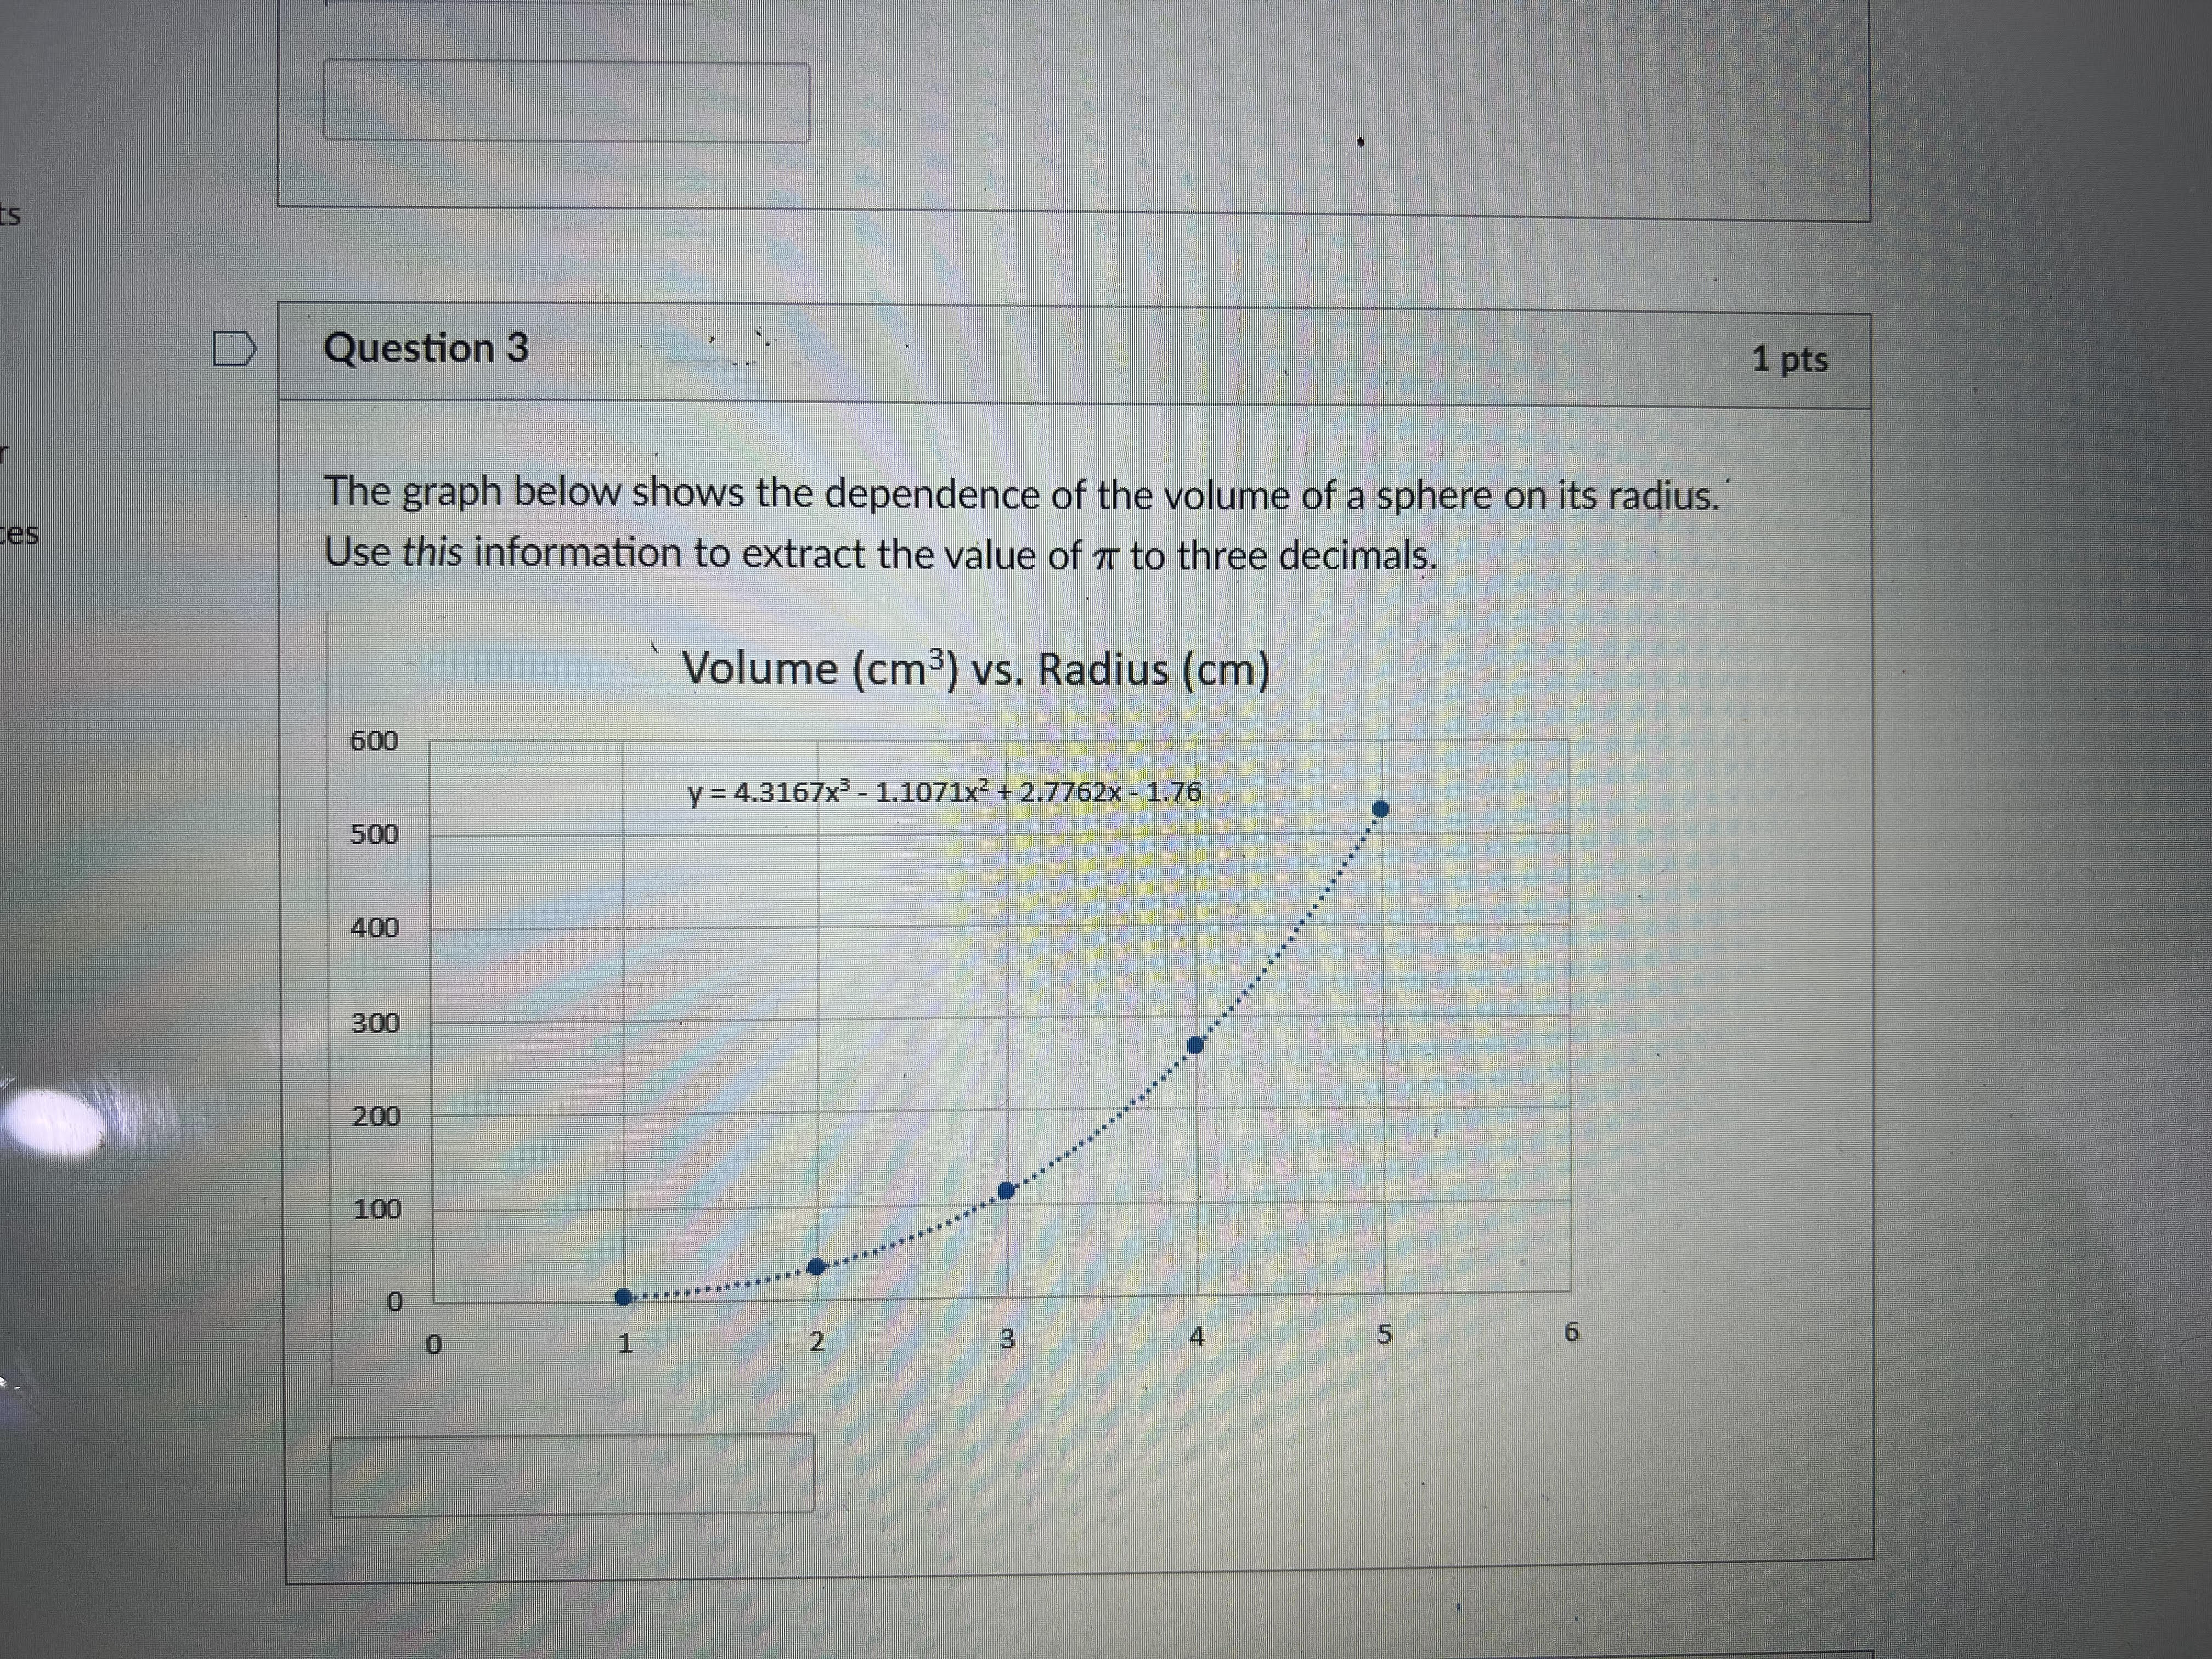
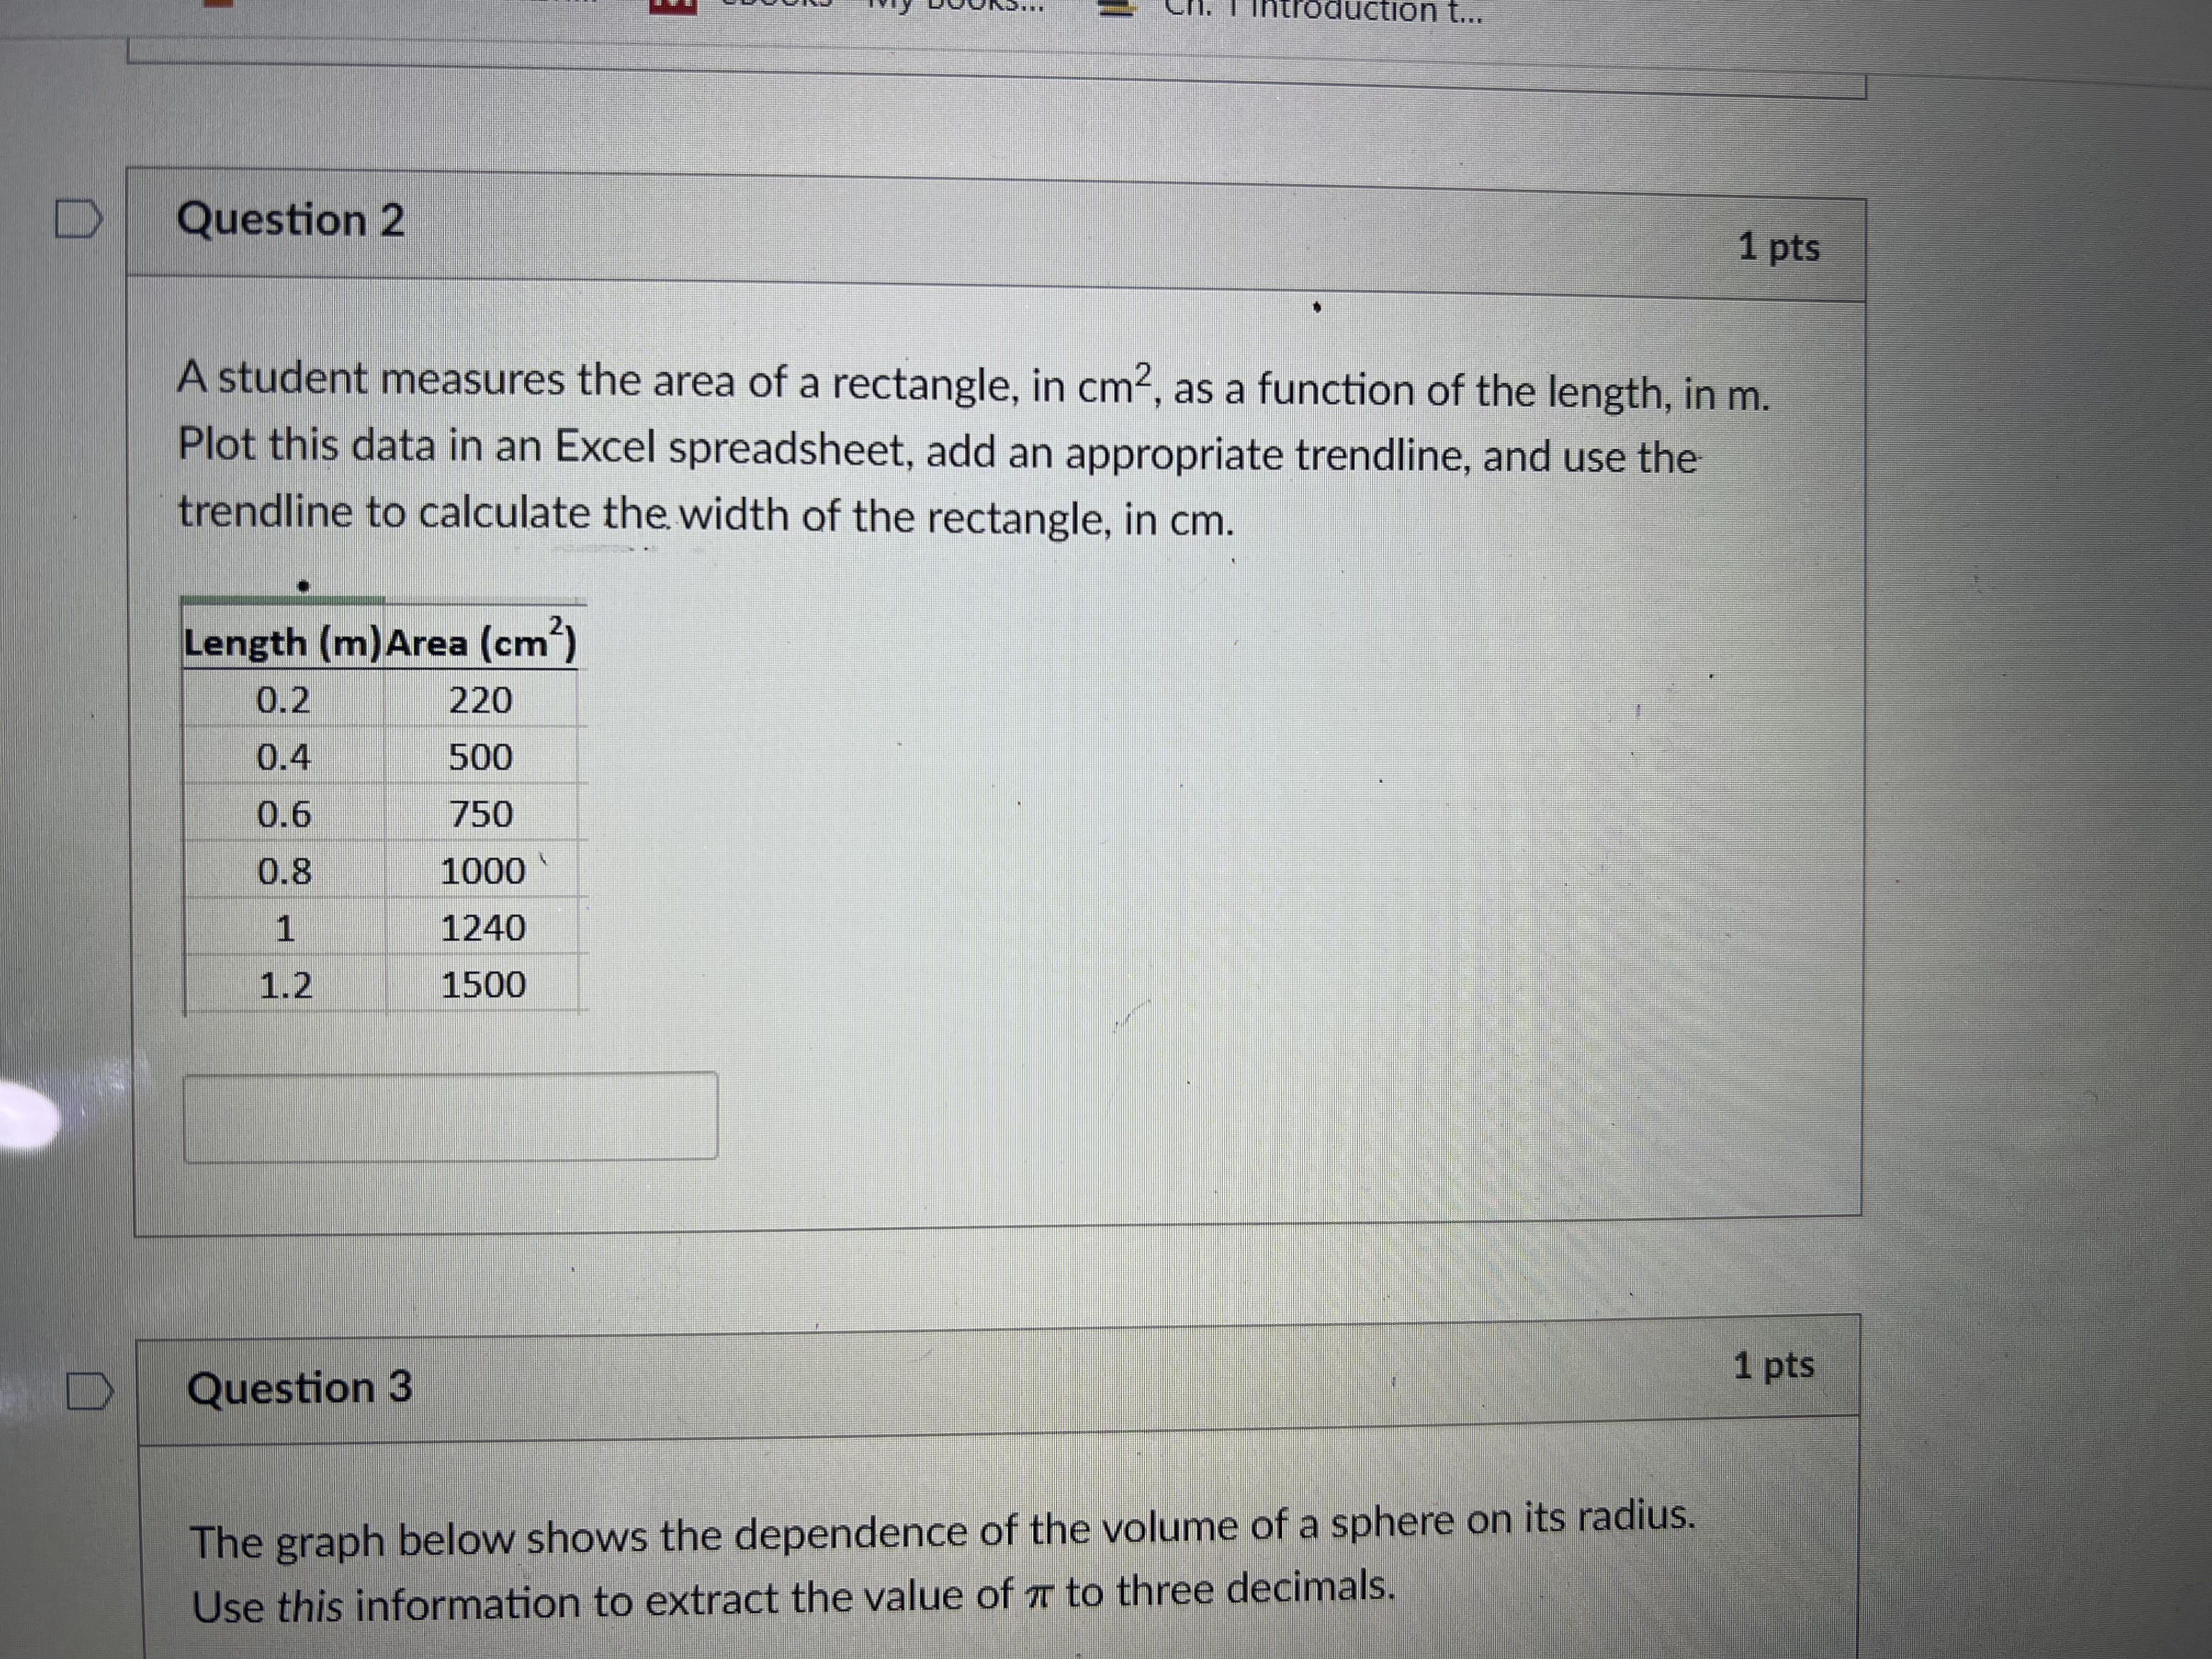


D Question 3 1 pts The graph below shows the dependence of the volume of a sphere on its radius. Use this information to extract the value of or to three decimals. Volume (cm3) vs. Radius (cm) 600 y = 4.3167x3 - 1.1071x2 + 2.7762x - 1.76 500 400 300 200 100 0 W Nnitroduction t... Question 2 1 pts A student measures the area of a rectangle, in cm, as a function of the length, in m. Plot this data in an Excel spreadsheet, add an appropriate trendline, and use the trendline to calculate the width of the rectangle, in cm. Length (m) Area (cm?) 0.2 220 0.4 500 0.6 750 0.8 1000 1 1240 1.2 1500 D Question 3 1 pts The graph below shows the dependence of the volume of a sphere on its radius. Use this information to extract the value of ir to three decimals
Step by Step Solution
There are 3 Steps involved in it

Get step-by-step solutions from verified subject matter experts