

Question: D Question 3 4 pts The graph below shows the sales S (in thousands of items) of a new item I months after entering the
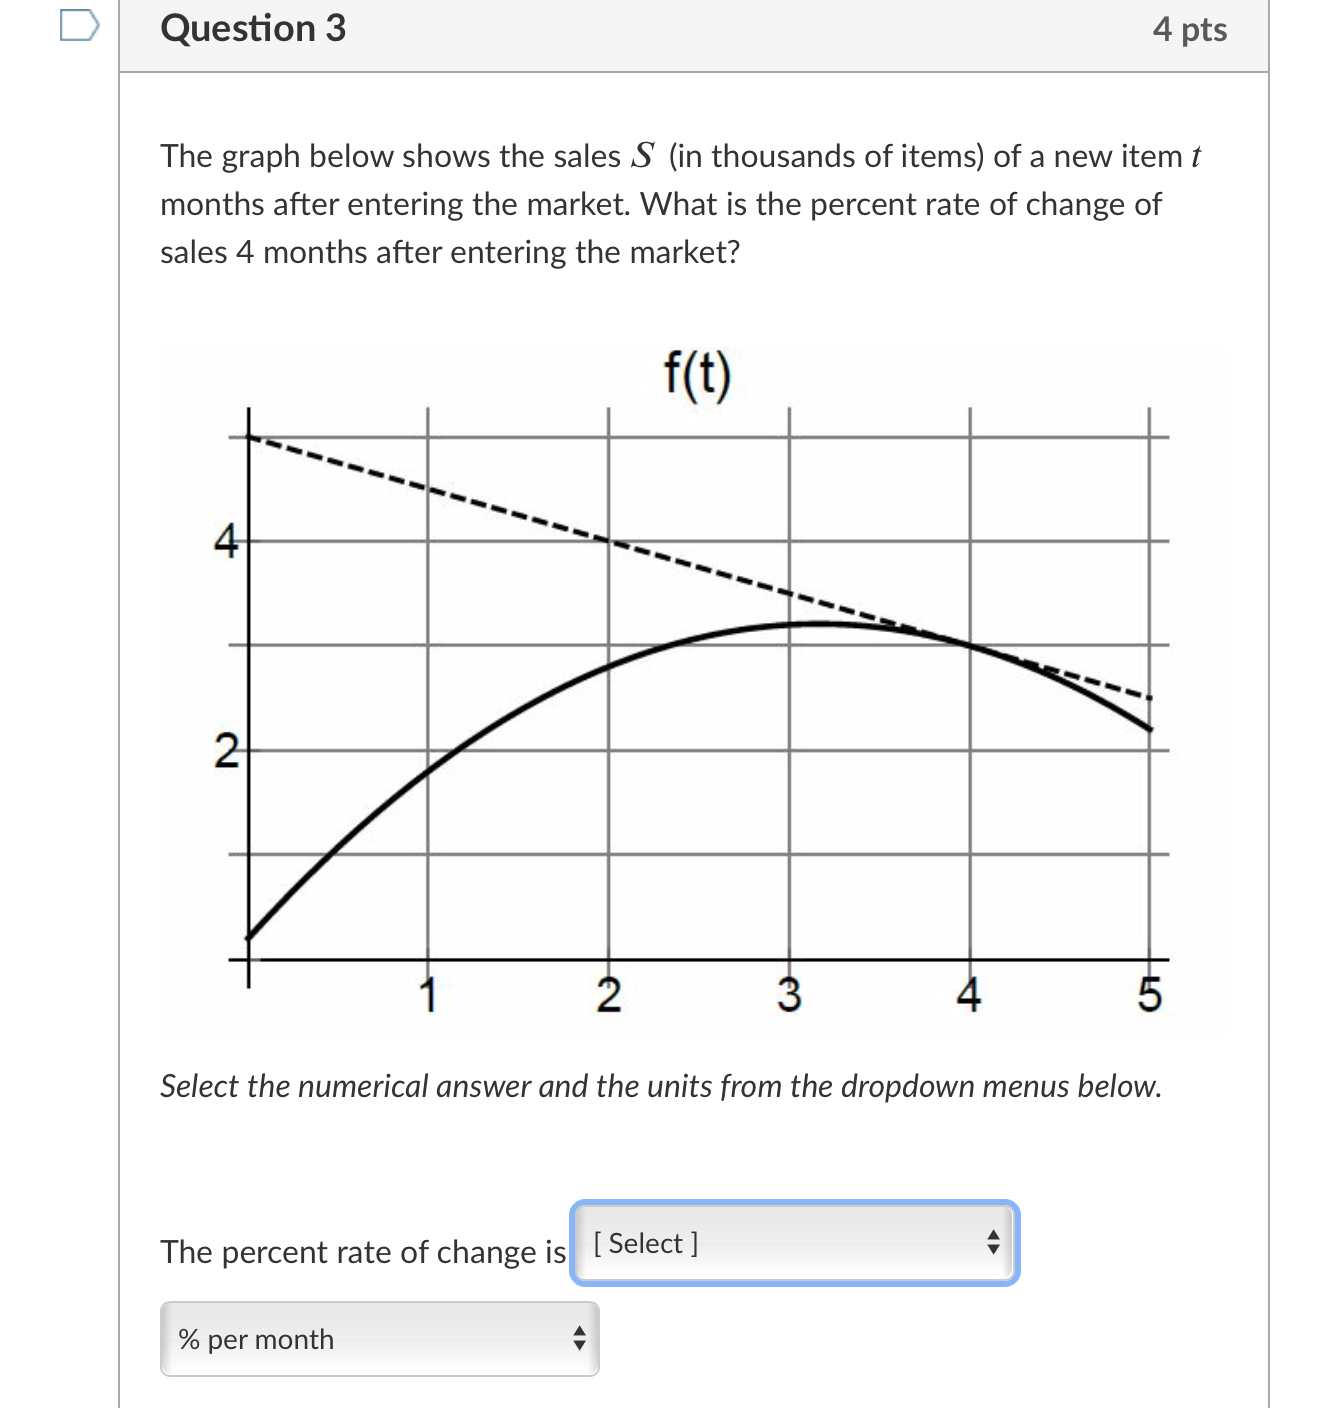
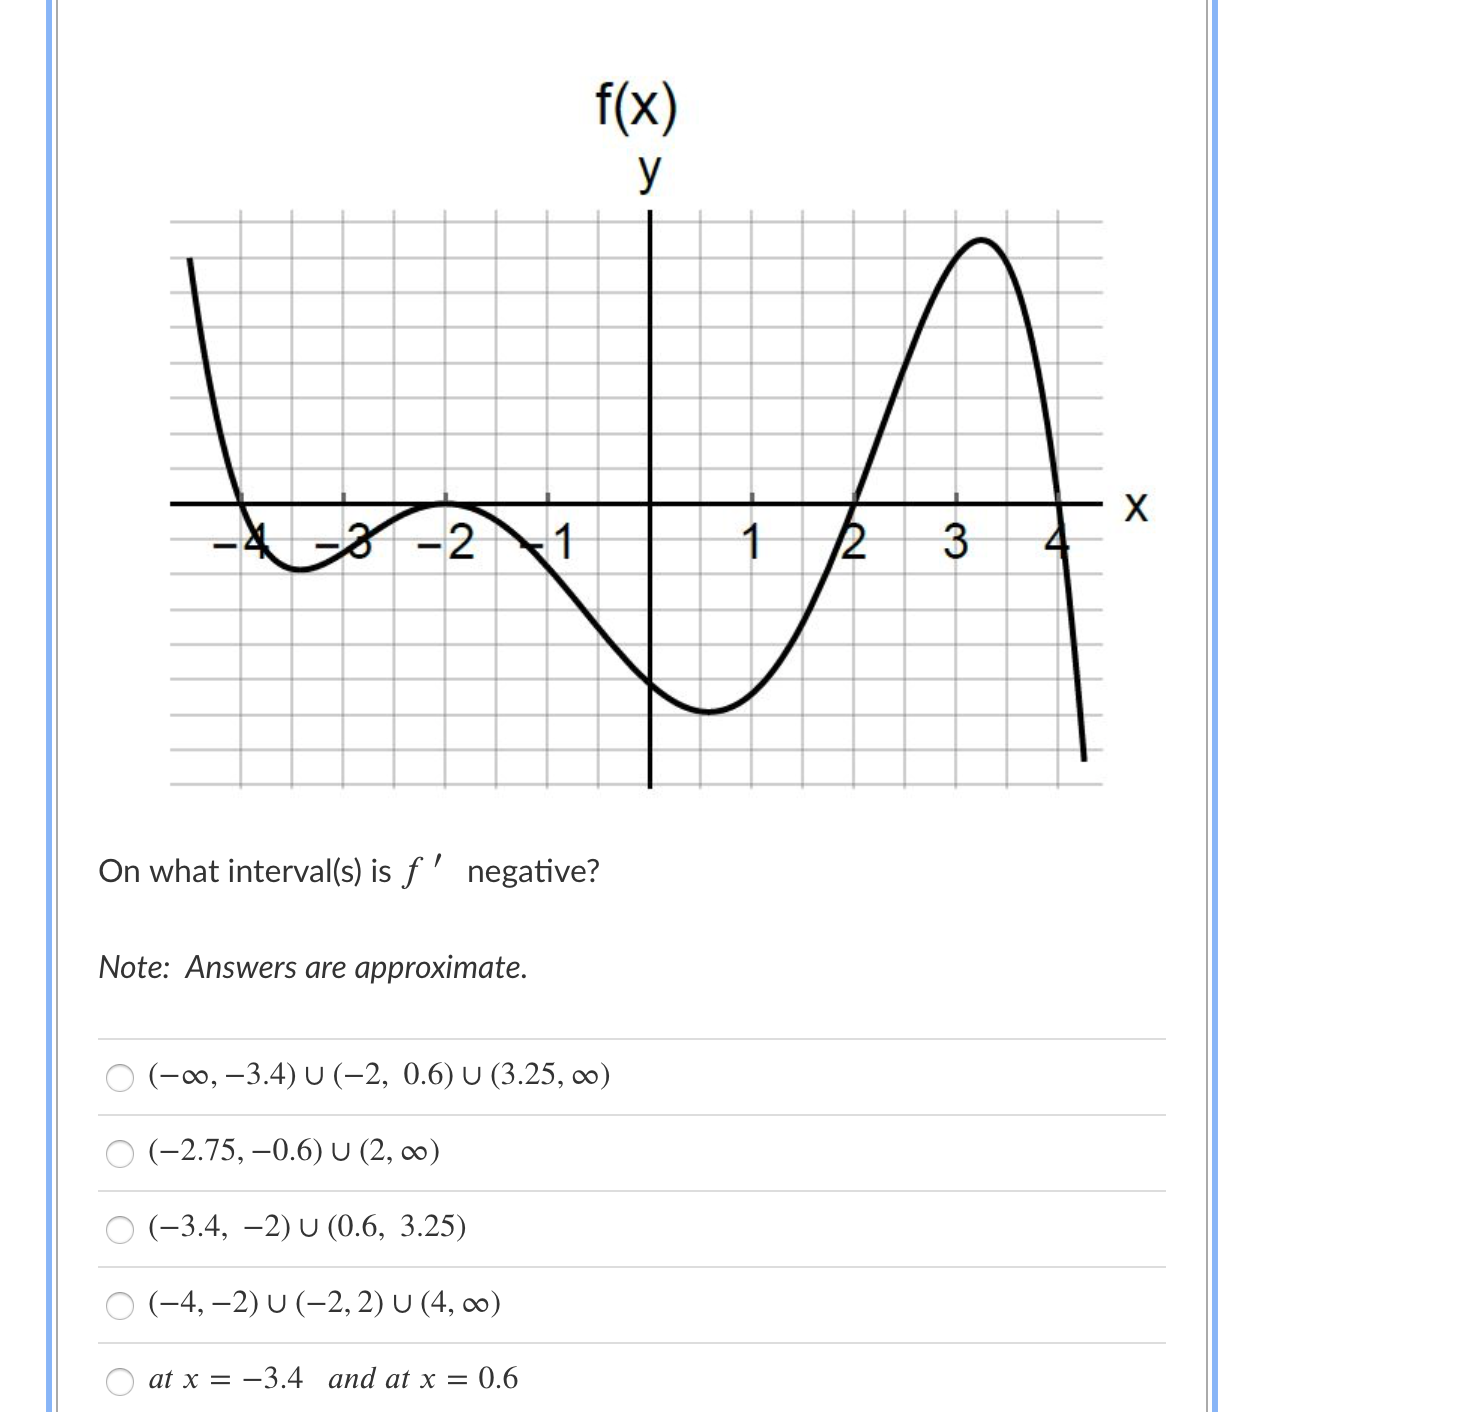
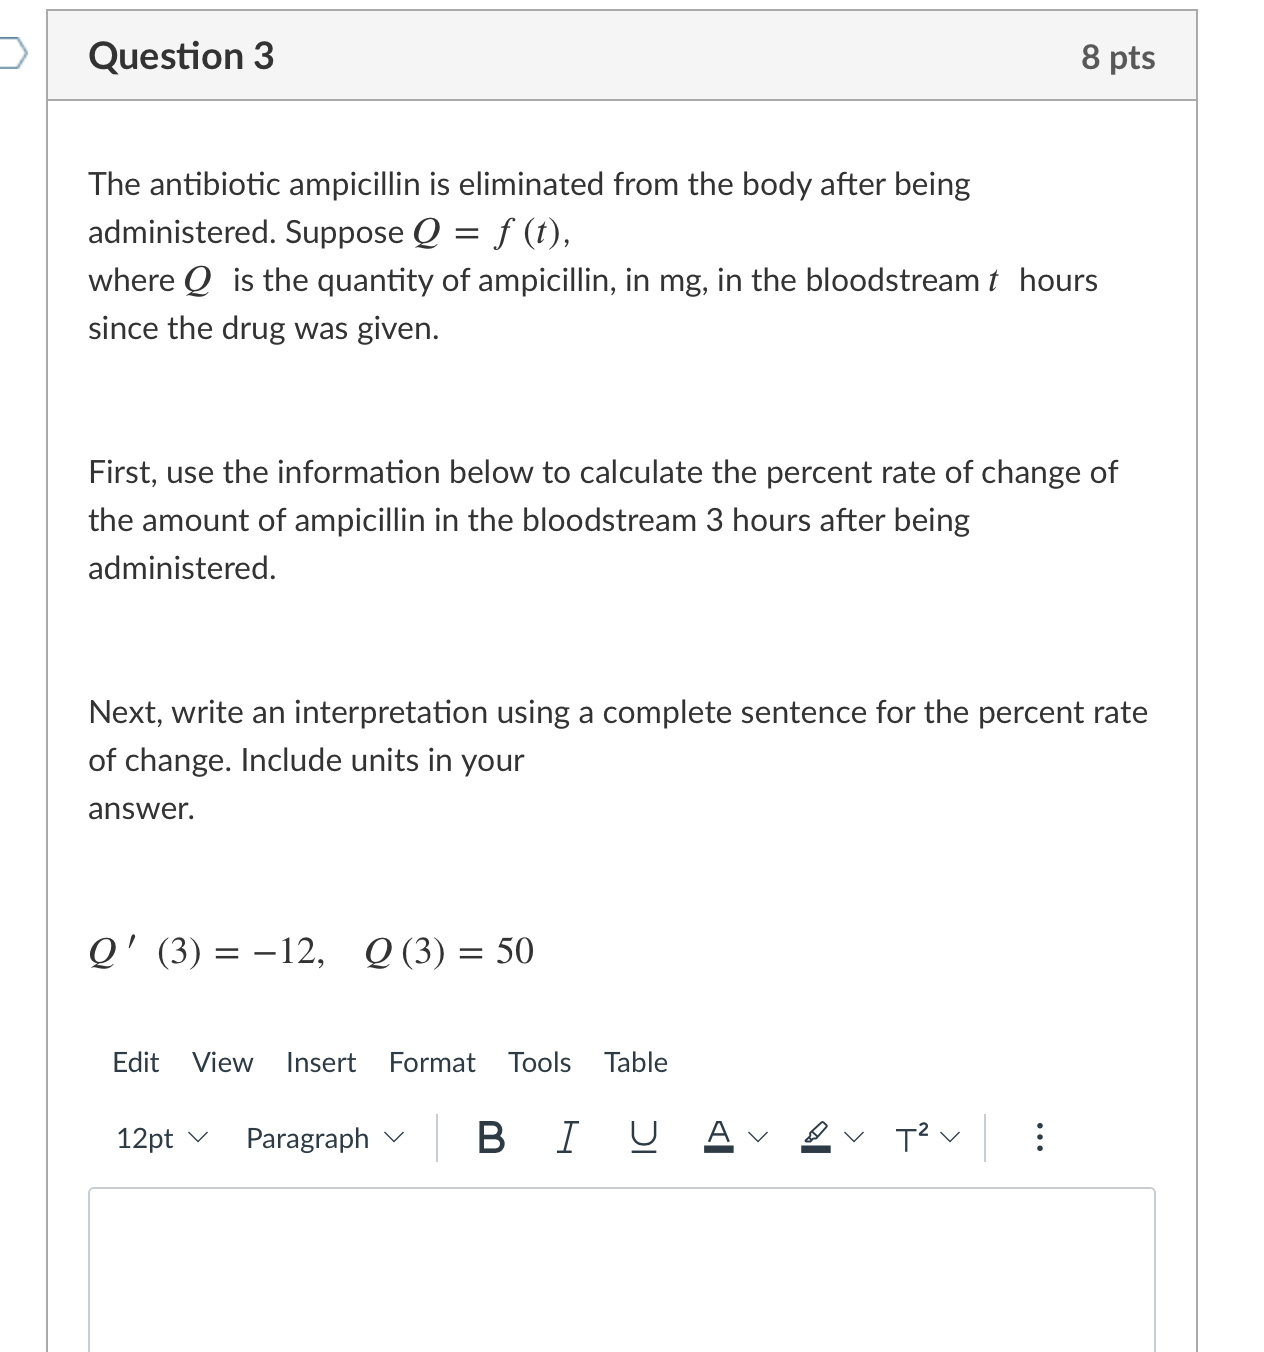
D Question 3 4 pts The graph below shows the sales S (in thousands of items) of a new item I months after entering the market. What is the percent rate of change of sales 4 months after entering the market? f(t) Select the numerical answer and the units from the dropdown menus below. _ A} The percent rate of change i- % per month f ( x ) y 8 - 2 1 X 1 2 3 On what interval(s) is f ' negative? Note: Answers are approximate. O (-00, - 3.4) U (-2, 0.6) U (3.25, 00) O (-2.75, -0.6) U (2, 00) O (-3.4, -2) U (0.6, 3.25) O ( -4, - 2) U ( - 2, 2) U (4, 00 ) at x = -3.4 and at x = 0.6_ The antibiotic ampicillin is eliminated from the body after being administered. Suppose Q = f0), where Q is the quantity of ampicillin, in mg, in the bloodstream 1' hours since the drug was given. First, use the information below to calculate the percent rate of change of the amount of ampicillin in the bloodstream 3 hours after being administered. Next, write an interpretation using a complete sentence for the percent rate of change. Include units in your answer. Q' (3) = -12, (2(3) = 50 Edit View Insert Format Tools Table 12ptV ParagraphV B I U Av 49v Tzv
Step by Step Solution
There are 3 Steps involved in it

Get step-by-step solutions from verified subject matter experts