

Question: D1. Use the assumptions described in the table when modeling items that are not computed as totals or subtotals. Variable Modeling assumptions Revenue Annual revenue
D1. Use the assumptions described in the table when modeling items that are not computed as totals or subtotals.
| Variable | Modeling assumptions |
| Revenue | Annual revenue growth in each forecast year is equal to 4.56 percent |
| Depreciation | Depreciation to sales in each forecast year is equal to the average annual ratio from the last 2 years of the historical period |
| Amortization | Amortization to revenue in each forecast year is 0.53 percentage points less than the average ratio from the historical period |
| Shareholders equity | Shareholders equity in each forecast year is $98,765 higher than shareholders equity in the previous year |
| Cash flows from operating activities | Cash flows from operating activities to revenue in each forecast year is equal to the ratio from the previous year |
| Cash flows from investing activities | Cash flows from investing activities is expected to be $9,043 lower in each forecast year than in the previous year |
| Cash flows from financing activities | The annual growth rate for cash flows from financing activities in each forecast year is equal to the average annual growth rate for cash flows from financing activities from the historical period |
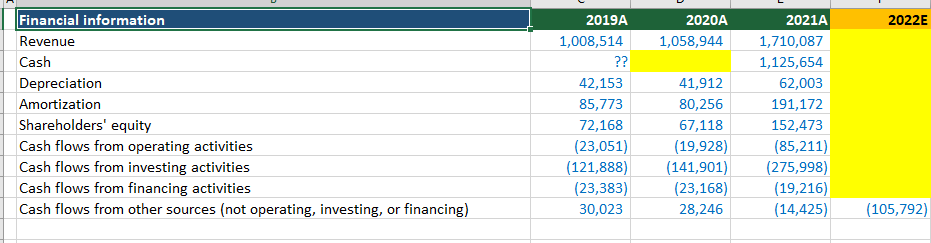
\begin{tabular}{|l|c|c|c|c|c|} \hline Financial information & 2019A & 2020A & \multicolumn{2}{|c|}{ 2021A } \\ \hline Revenue & 1,008,514 & 1,058,944 & 1,710,087 \\ \hline Cash & 2022E \\ \hline Depreciation & 42,153 & 41,912 & 62,003 \\ \hline Amortization & 85,773 & 80,256 & 191,172 \\ \hline Shareholders' equity & 72,168 & 67,118 & 152,473 \\ \hline Cash flows from operating activities & (23,051) & (19,928) & (85,211) \\ \hline Cash flows from investing activities & (121,888) & (141,901) & (275,998) \\ \hline Cash flows from financing activities & (23,383) & (23,168) & (19,216) \\ \hline Cash flows from other sources (not operating, investing, or financing) & 30,023 & 28,246 & (14,425) & (105,792) \\ \hline \end{tabular} \begin{tabular}{|l|c|c|c|c|c|} \hline Financial information & 2019A & 2020A & \multicolumn{2}{|c|}{ 2021A } \\ \hline Revenue & 1,008,514 & 1,058,944 & 1,710,087 \\ \hline Cash & 2022E \\ \hline Depreciation & 42,153 & 41,912 & 62,003 \\ \hline Amortization & 85,773 & 80,256 & 191,172 \\ \hline Shareholders' equity & 72,168 & 67,118 & 152,473 \\ \hline Cash flows from operating activities & (23,051) & (19,928) & (85,211) \\ \hline Cash flows from investing activities & (121,888) & (141,901) & (275,998) \\ \hline Cash flows from financing activities & (23,383) & (23,168) & (19,216) \\ \hline Cash flows from other sources (not operating, investing, or financing) & 30,023 & 28,246 & (14,425) & (105,792) \\ \hline \end{tabular}
Step by Step Solution
There are 3 Steps involved in it

Get step-by-step solutions from verified subject matter experts