

Question: Please show the formula on excel please! Q2. Use the assumptions described in the table when modeling items that are not computed as totals or
Please show the formula on excel please!
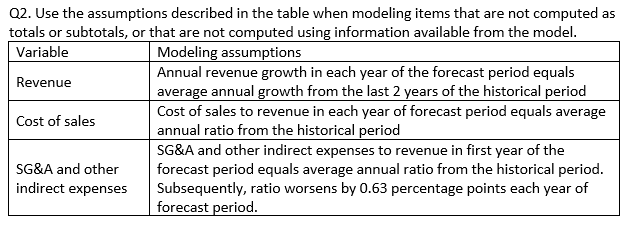
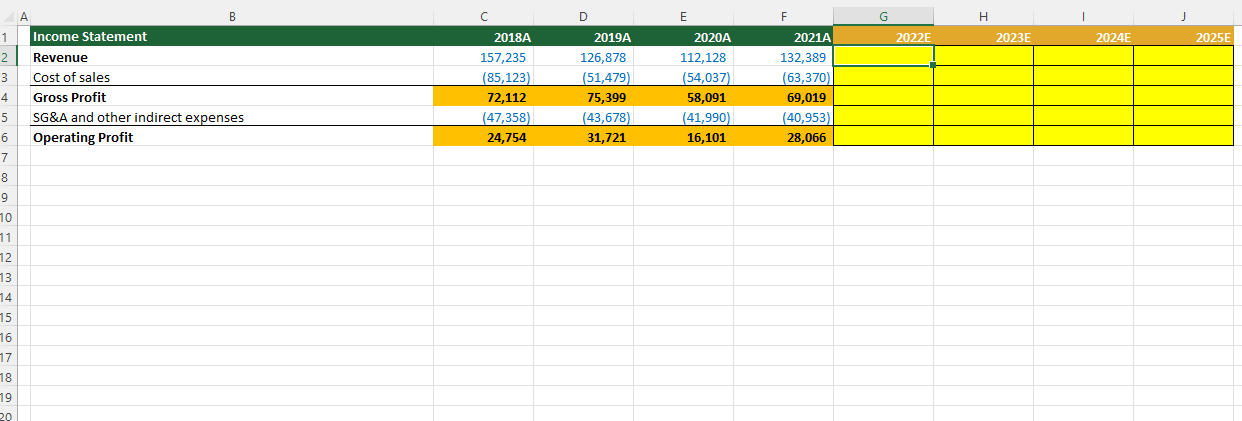
Q2. Use the assumptions described in the table when modeling items that are not computed as totals or subtotals, or that are not computed using information available from the model. Variable Modeling assumptions Annual revenue growth in each year of the forecast period equals Revenue average annual growth from the last 2 years of the historical period Cost of sales Cost of sales to revenue in each year of forecast period equals average annual ratio from the historical period SG&A and other indirect expenses to revenue in first year of the SG&A and other forecast period equals average annual ratio from the historical period. indirect expenses Subsequently, ratio worsens by 0.63 percentage points each year of forecast period. D E F G H 2019A 2022E 2023E 2024E 2025E A B Income Statement Revenue Cost of sales Gross Profit SG&A and other indirect expenses Operating Profit 2018A 157,235 (85,123) 72,112 (47,358) 24,754 126,878 (51,479) 75,399 (43,678) 31,721 2020A 112,128 (54,037) 58,091 (41,990) 16,101 2021A 132,389 (63,370) 69,019 (40,953) 28,066 1 2 3 4 5 6 7 8 9 10 11 12 13 14 15 16 17 18 19 20 Q2. Use the assumptions described in the table when modeling items that are not computed as totals or subtotals, or that are not computed using information available from the model. Variable Modeling assumptions Annual revenue growth in each year of the forecast period equals Revenue average annual growth from the last 2 years of the historical period Cost of sales Cost of sales to revenue in each year of forecast period equals average annual ratio from the historical period SG&A and other indirect expenses to revenue in first year of the SG&A and other forecast period equals average annual ratio from the historical period. indirect expenses Subsequently, ratio worsens by 0.63 percentage points each year of forecast period. D E F G H 2019A 2022E 2023E 2024E 2025E A B Income Statement Revenue Cost of sales Gross Profit SG&A and other indirect expenses Operating Profit 2018A 157,235 (85,123) 72,112 (47,358) 24,754 126,878 (51,479) 75,399 (43,678) 31,721 2020A 112,128 (54,037) 58,091 (41,990) 16,101 2021A 132,389 (63,370) 69,019 (40,953) 28,066 1 2 3 4 5 6 7 8 9 10 11 12 13 14 15 16 17 18 19 20
Step by Step Solution
There are 3 Steps involved in it

Get step-by-step solutions from verified subject matter experts