

Question: DaCK II E Create a Chart 1. Create a chart by rst selecting the cell ranges for the chart. Drag from cell A4 to A14
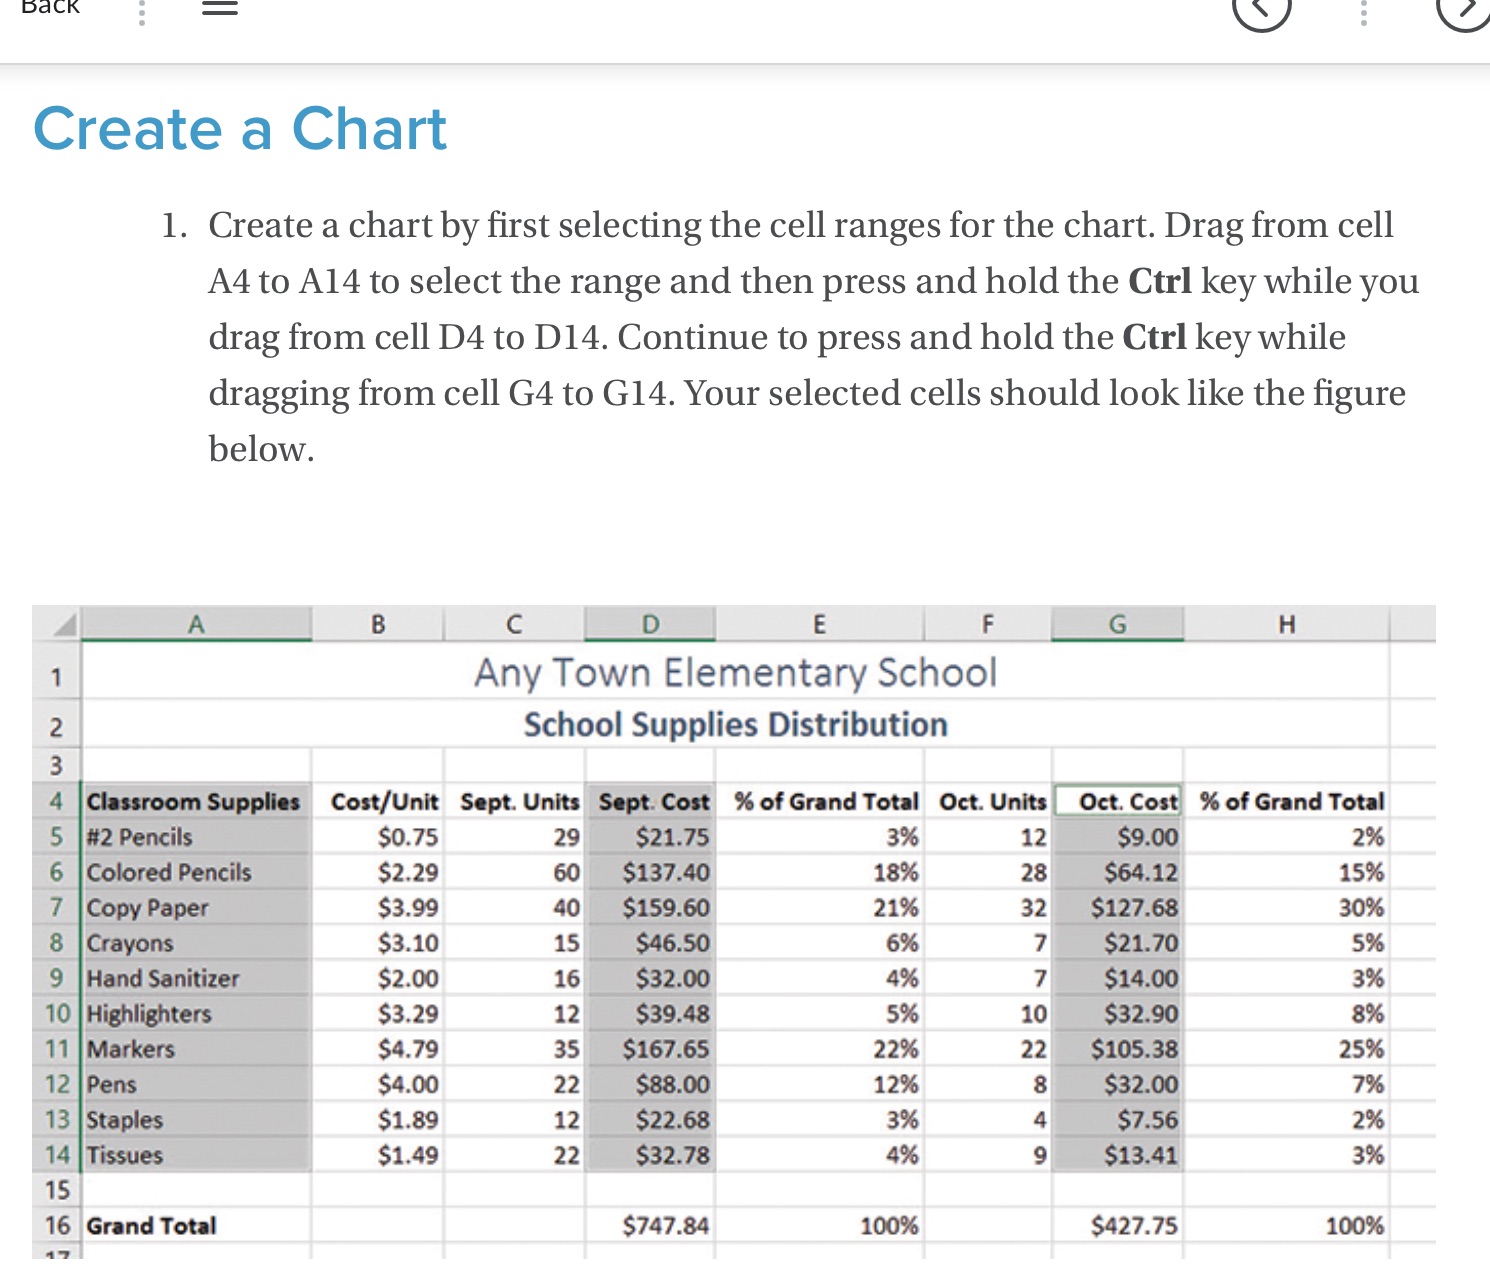
DaCK II E Create a Chart 1. Create a chart by rst selecting the cell ranges for the chart. Drag from cell A4 to A14 to select the range and then press and hold the Ctrl key while you drag from cell D4 to D14. Continue to press and hold the Ctrl key while dragging from cell G4 to G14. Your selected cells should look like the gure below. Any Town Elementary School School Supplies Distribution " CootIUnlt 5mm ' mm scion-arrow $0.75 29r *'~ " 2% $2.29 so 15% $3.99 qol 20% $3.10 15 596 $2.00 16 3% $3.29 12 896 $4.29 35 25% $4.00 22 7% $1.39 12 296 $1.49 22 3% 10096
Step by Step Solution
There are 3 Steps involved in it
1 Expert Approved Answer
Step: 1 Unlock

Question Has Been Solved by an Expert!
Get step-by-step solutions from verified subject matter experts
Step: 2 Unlock
Step: 3 Unlock