

Question: Data and Report Submission - Freezing-Point Depression (Sort lable FP.1: Freezing Point of Solvent (Stearic Acid) Time and to SUMMARY Time and Temperature Data: Cooling
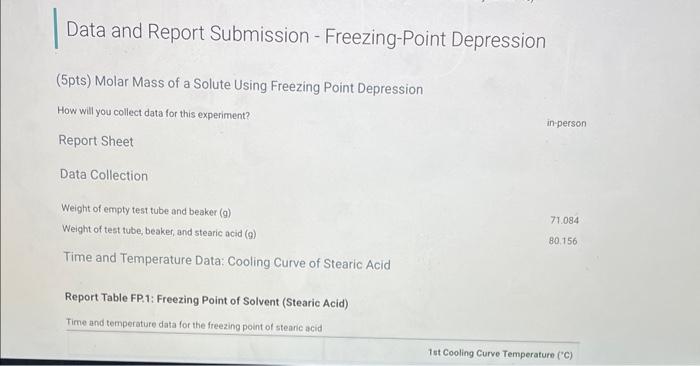
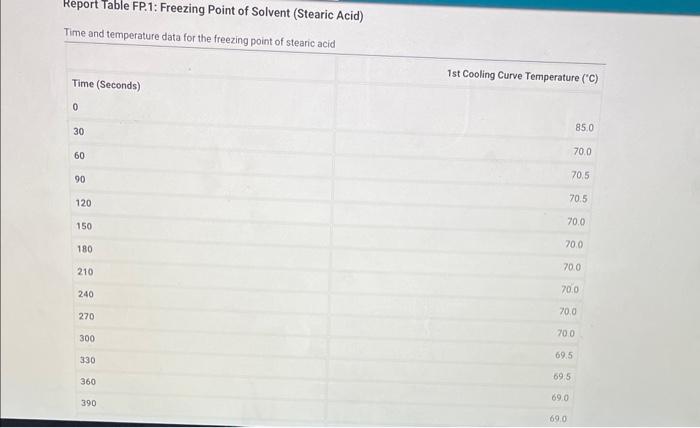
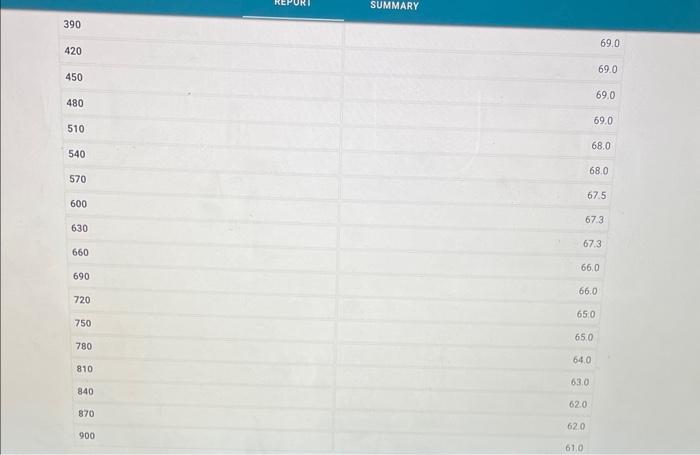
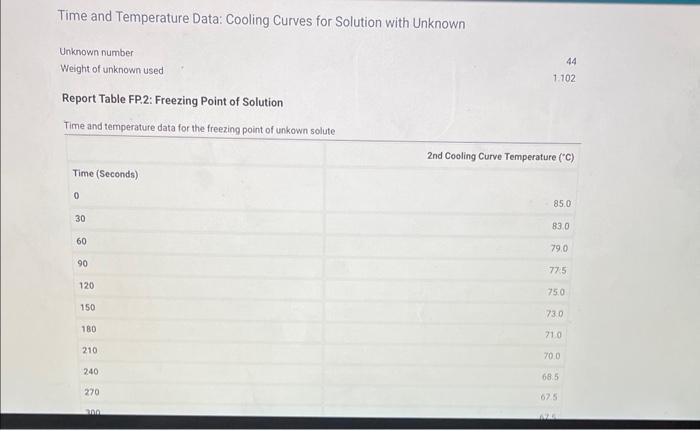
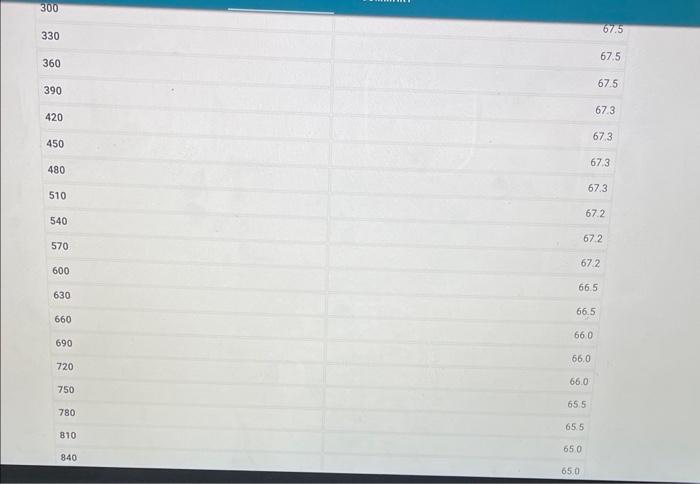
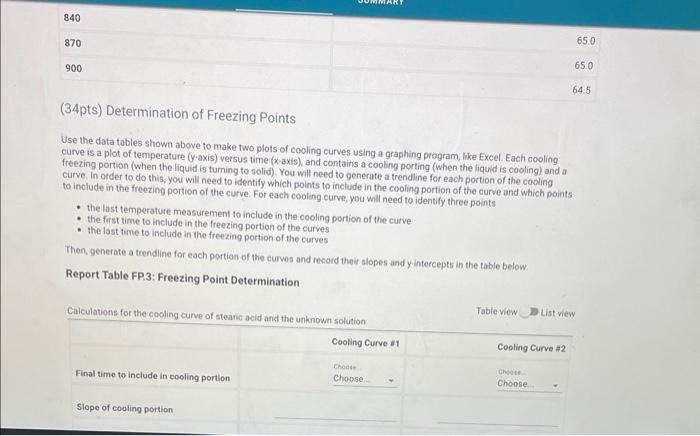
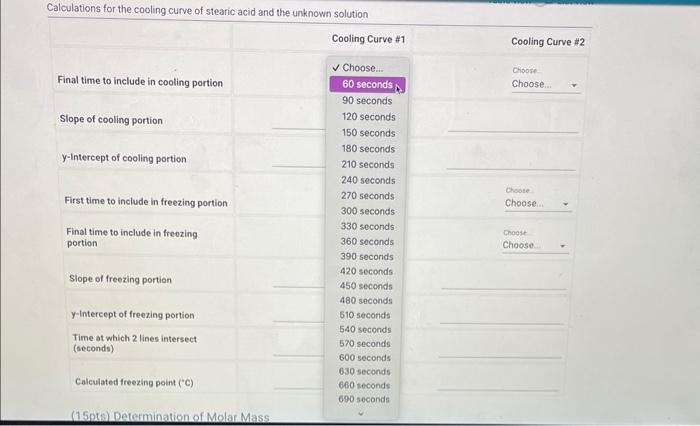
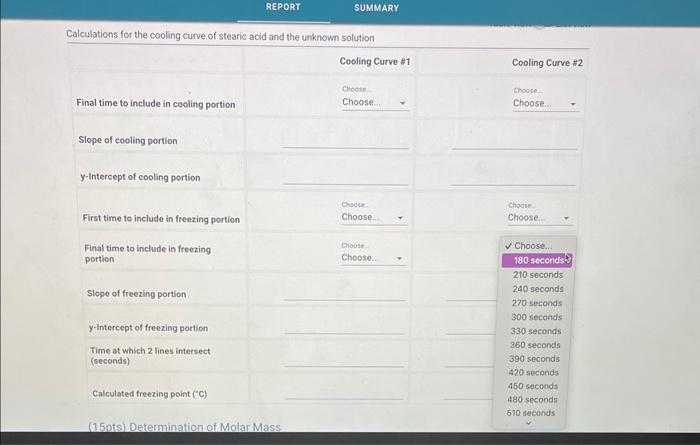
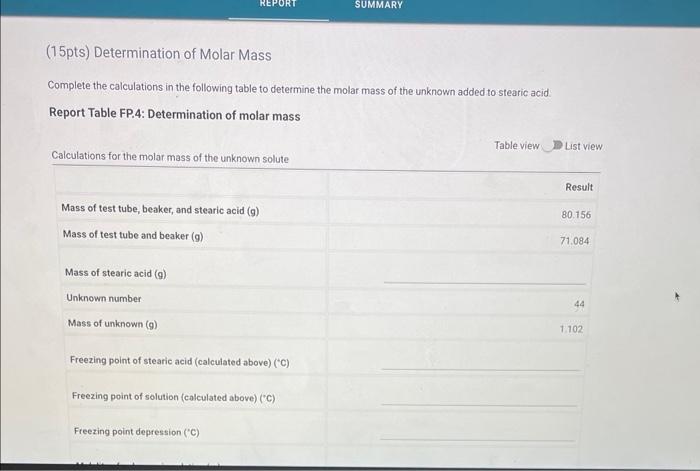
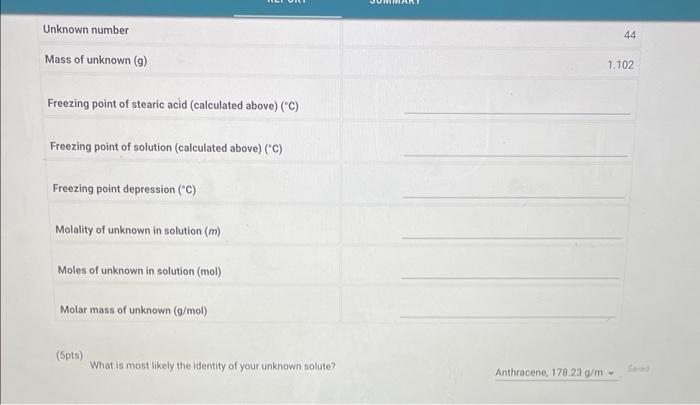
Data and Report Submission - Freezing-Point Depression (Sort lable FP.1: Freezing Point of Solvent (Stearic Acid) Time and to SUMMARY Time and Temperature Data: Cooling Curves for Solution with Unknown (34pts) Determination of Freezing Points Use the data tables shown above to make two plots of cooling curves using a graphing program, like Excel. Each cooling curve is a plot of temperature ( y-axis) versus time ( x-axis), and contains a cooling porting (when the liquid is cooling) and a freezing portion (when the liquid is turning to solid). You will need to generate a trendline for each portion of the cooling curve. In order to do this, you will need to identify which points to include in the cooling portion of the curve and which points to include in the freezing portion of the curve. For each cooling curve, you will need to identify three points - the last temperature measurement to include in the cooling portion of the curve. - the first time to include in the freezing portion of the curves - the last time to include in the freezing portion of the curves Then, generate a trendline for each portion of the curves and record their slopes and y.intercepts in the table below: Report Table FP.3: Freezing Point Determination Calculations for the cooling curve of stearic acid and the unknown solution Calculations for the cooling curve: of stearic acid and the unknown solution. Cooling Curve \#1 Cooling Curve \#2 Final time to include in cooling portion Slope of cooling portion y-Intercept of cooling portion First time to include in freezing portion Final time to include in freezing portion. Slope of freezing portion y-Intercept of freezing portion Time at which 2 lines intersect (ceconds) Choote. Choose: Choore Choose... Table view: List view. Unknown number 44 Mass of unknown ( g ) 1.102 Freezing point of stearic acid (calculated above) (C) Freezing point of solution (calculated above) ('C) Freezing point depression ("C) Molality of unknown in solution ( m ) Moles of unknown in solution (mol) Molar mass of unknown (g/mol) (Spts) What is most likely the identity of your unknown solute? Anthracene, 178.23g/m= Shemit Data and Report Submission - Freezing-Point Depression (Sort lable FP.1: Freezing Point of Solvent (Stearic Acid) Time and to SUMMARY Time and Temperature Data: Cooling Curves for Solution with Unknown (34pts) Determination of Freezing Points Use the data tables shown above to make two plots of cooling curves using a graphing program, like Excel. Each cooling curve is a plot of temperature ( y-axis) versus time ( x-axis), and contains a cooling porting (when the liquid is cooling) and a freezing portion (when the liquid is turning to solid). You will need to generate a trendline for each portion of the cooling curve. In order to do this, you will need to identify which points to include in the cooling portion of the curve and which points to include in the freezing portion of the curve. For each cooling curve, you will need to identify three points - the last temperature measurement to include in the cooling portion of the curve. - the first time to include in the freezing portion of the curves - the last time to include in the freezing portion of the curves Then, generate a trendline for each portion of the curves and record their slopes and y.intercepts in the table below: Report Table FP.3: Freezing Point Determination Calculations for the cooling curve of stearic acid and the unknown solution Calculations for the cooling curve: of stearic acid and the unknown solution. Cooling Curve \#1 Cooling Curve \#2 Final time to include in cooling portion Slope of cooling portion y-Intercept of cooling portion First time to include in freezing portion Final time to include in freezing portion. Slope of freezing portion y-Intercept of freezing portion Time at which 2 lines intersect (ceconds) Choote. Choose: Choore Choose... Table view: List view. Unknown number 44 Mass of unknown ( g ) 1.102 Freezing point of stearic acid (calculated above) (C) Freezing point of solution (calculated above) ('C) Freezing point depression ("C) Molality of unknown in solution ( m ) Moles of unknown in solution (mol) Molar mass of unknown (g/mol) (Spts) What is most likely the identity of your unknown solute? Anthracene, 178.23g/m= Shemit
Step by Step Solution
There are 3 Steps involved in it

Get step-by-step solutions from verified subject matter experts