

Question: please show work. Part 1 Time and Temperature Data: Cooling Curve of Distilled Water Report Table 1: Time and Temperature Data: Pure Stearic Acid Time
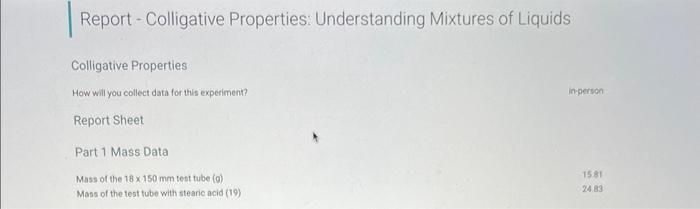
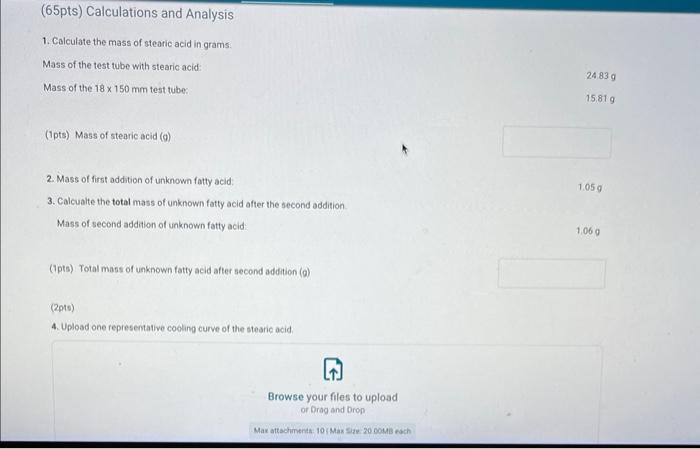
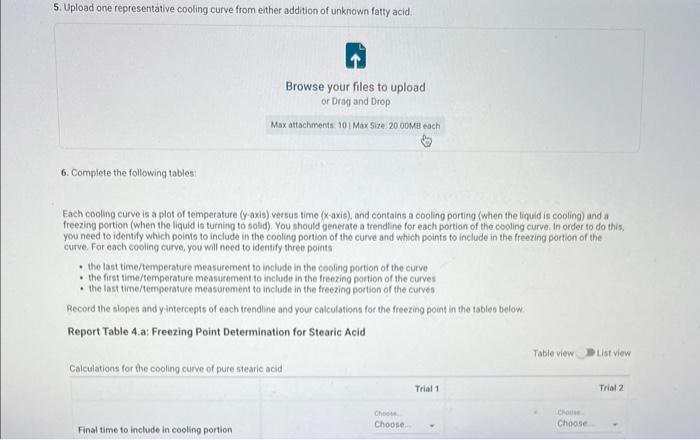
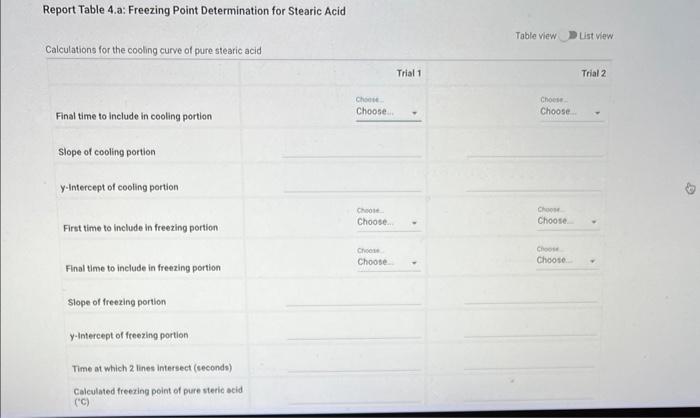
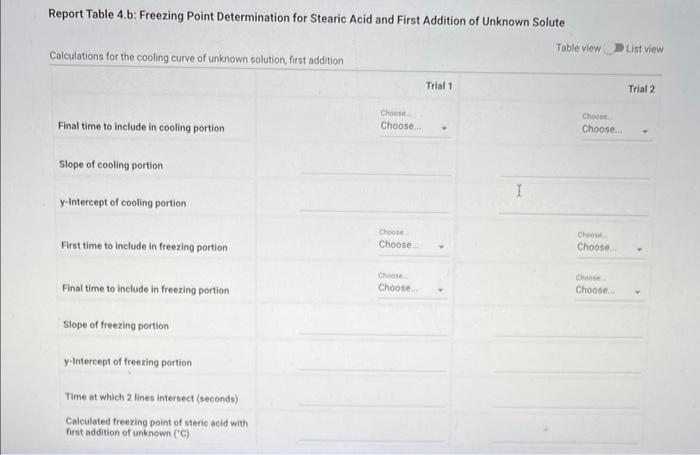
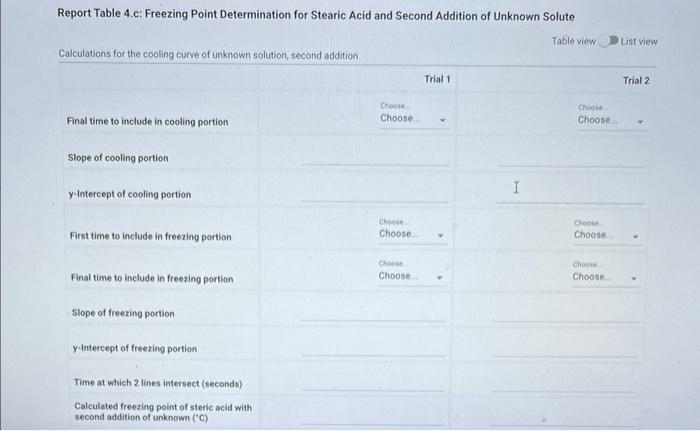
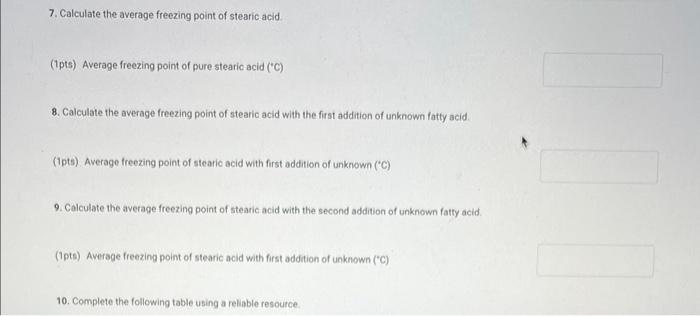
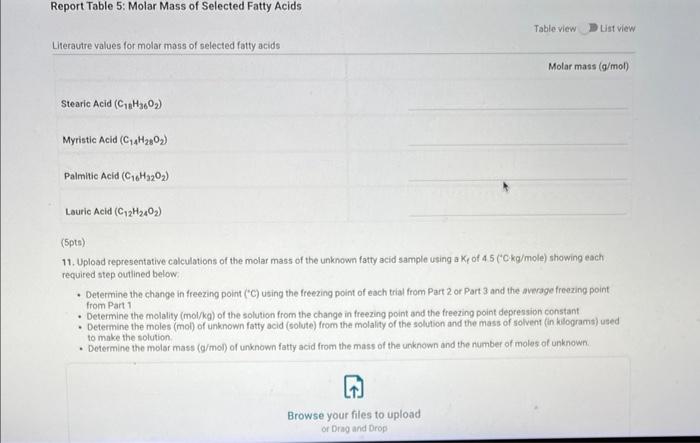
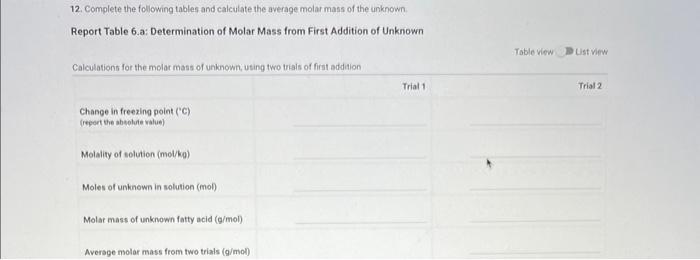
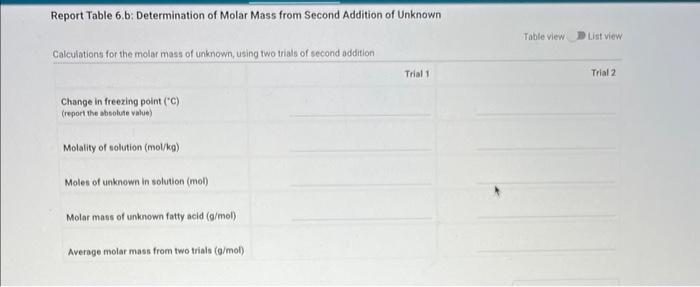
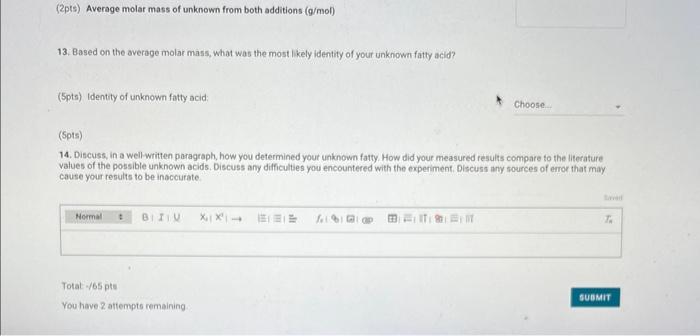
Report - Colligative Properties: Understanding Mixtures of Liquids Colligative Properties How will you collect data for this experiment? Report Sheet Part 1 Mass Data Mass of the 18150mm test tube (o) Mass of the test fube with stearic acid (19) (65pts) Calculations and Analysis 1. Calculate the mass of stearic acid in grams: Mass of the test tube with stearic acid: Mass of the 18150mm test tube: (1pts) Mass of stearic acid (9) 2. Mass of first addition of unknown fatty acid: 1.059 3. Calcualte the total mass of unknown fatty acid after the second addition Mass of second addition of unknown fatty acid: 1,060 (1pts) Total mass of unknown tatty acid after second addition ( 9 ) (29ts) 4. Upload one representative cooling curve of the stearic acid. Browse your files to upload or Drag and Drop Max aftechimenta 10 Mas sue 20 oomis roch 5. Upload one representative cooling curve from either addition of unknown fatty acid. 6. Complete the following tables: Each cooling curve is a plot of temperature ( y-axis) versus time ( x-axis), and contains a cooling porting (when the liquid is cooling) and a freezing portion (when the liquid is turning to solid). You should generate a trendline for each portion of the cooling curve. In order to do this, you need to identify which points to include in the cooling portion of the curve and which points to include in the freezing portion of the curve. For each cooling curve, you will need to identify three points - the last time/temperature mearurement to include in the cooling portion of the curve - the first time/temperature measurement to include in the freezing portion of the curves - the last time/temperature measurement to include in the freezing portion of the curves Record the slopes and yintercepts of each trendline and your calculations for the freezing point in the tableo below. Report Table 4.a: Freezing Point Determination for Stearic Acid Report Table 4.a: Freezing Point Determination for Stearic Acid Report Table 4.b: Freezing Point Determination for Stearic Acid and First Addition of Unknown Solute Report Table 4.c: Freezing Point Determination for Stearic Acid and Second Addition of Unknown Solute Table view Dust view 7. Calculate the average freezing point of stearic acid (1pts) Average freezing point of pure stearic acid ('C) 8. Calculate the average freezing point of stearic acid with the first addition of unknown fatty acid. (1pts). Average freezing point of stearic acid with first addition of unknown ('C) 9. Calculate the average freezing point of stearic acid with the second addition of unknown fatty acid. (1pts) Average freezing point of stearic acid with first addition of unknown ("C) 10. Complete the following table using a reliable resource. 11. Upload representative calculations of the molar mass of the unknown fatty acid sample using a Ke of 4.5( ( Ckg/mole) showing each required step outlined below; - Determine the change in freezing point ("C) using the freezing point of each trial from Part 2 or Part 3 and the average freezing point from Part 1 - Determine the molality (mol// kg ) of the solution from the change in freezing point and the freezing point depression constant - Determine the moles (mol) of unknown fatty acid (solute) from the molality of the solution and the mass of solvent (in kilograms) used to make the solution - Determine the molar mass ( g/m mol) of unknown fatty acid from the mass of the unknown and the number of moles of unknown. 12. Complete the following tables and calculate the average molar mass of the unknown. Report Table 6.a: Determination of Molar Mass from First Addition of Unknown Renort Tahle 6.h: Determination of Molar Mase from Second Addition of Unknown (2pts) Average molar mass of unknown from both additions ( q/mol) 13. Based on the average molar mass, what was the most likely identity of your unknown fatty acid? (5pts) Identity of unknown fatty acid: Choose (Spts) 14. Discuss, in a well-written paragraph, how you determined yout uniknown fatty. How did your measured results compare to the literature values of the possible unknown acids. Discuss any difficulties you encountered with the experiment. Discuss ary sources of error that may cause your results to be inaccurate. Totat /65pte You have 2 aftempts remaining Report - Colligative Properties: Understanding Mixtures of Liquids Colligative Properties How will you collect data for this experiment? Report Sheet Part 1 Mass Data Mass of the 18150mm test tube (o) Mass of the test fube with stearic acid (19) (65pts) Calculations and Analysis 1. Calculate the mass of stearic acid in grams: Mass of the test tube with stearic acid: Mass of the 18150mm test tube: (1pts) Mass of stearic acid (9) 2. Mass of first addition of unknown fatty acid: 1.059 3. Calcualte the total mass of unknown fatty acid after the second addition Mass of second addition of unknown fatty acid: 1,060 (1pts) Total mass of unknown tatty acid after second addition ( 9 ) (29ts) 4. Upload one representative cooling curve of the stearic acid. Browse your files to upload or Drag and Drop Max aftechimenta 10 Mas sue 20 oomis roch 5. Upload one representative cooling curve from either addition of unknown fatty acid. 6. Complete the following tables: Each cooling curve is a plot of temperature ( y-axis) versus time ( x-axis), and contains a cooling porting (when the liquid is cooling) and a freezing portion (when the liquid is turning to solid). You should generate a trendline for each portion of the cooling curve. In order to do this, you need to identify which points to include in the cooling portion of the curve and which points to include in the freezing portion of the curve. For each cooling curve, you will need to identify three points - the last time/temperature mearurement to include in the cooling portion of the curve - the first time/temperature measurement to include in the freezing portion of the curves - the last time/temperature measurement to include in the freezing portion of the curves Record the slopes and yintercepts of each trendline and your calculations for the freezing point in the tableo below. Report Table 4.a: Freezing Point Determination for Stearic Acid Report Table 4.a: Freezing Point Determination for Stearic Acid Report Table 4.b: Freezing Point Determination for Stearic Acid and First Addition of Unknown Solute Report Table 4.c: Freezing Point Determination for Stearic Acid and Second Addition of Unknown Solute Table view Dust view 7. Calculate the average freezing point of stearic acid (1pts) Average freezing point of pure stearic acid ('C) 8. Calculate the average freezing point of stearic acid with the first addition of unknown fatty acid. (1pts). Average freezing point of stearic acid with first addition of unknown ('C) 9. Calculate the average freezing point of stearic acid with the second addition of unknown fatty acid. (1pts) Average freezing point of stearic acid with first addition of unknown ("C) 10. Complete the following table using a reliable resource. 11. Upload representative calculations of the molar mass of the unknown fatty acid sample using a Ke of 4.5( ( Ckg/mole) showing each required step outlined below; - Determine the change in freezing point ("C) using the freezing point of each trial from Part 2 or Part 3 and the average freezing point from Part 1 - Determine the molality (mol// kg ) of the solution from the change in freezing point and the freezing point depression constant - Determine the moles (mol) of unknown fatty acid (solute) from the molality of the solution and the mass of solvent (in kilograms) used to make the solution - Determine the molar mass ( g/m mol) of unknown fatty acid from the mass of the unknown and the number of moles of unknown. 12. Complete the following tables and calculate the average molar mass of the unknown. Report Table 6.a: Determination of Molar Mass from First Addition of Unknown Renort Tahle 6.h: Determination of Molar Mase from Second Addition of Unknown (2pts) Average molar mass of unknown from both additions ( q/mol) 13. Based on the average molar mass, what was the most likely identity of your unknown fatty acid? (5pts) Identity of unknown fatty acid: Choose (Spts) 14. Discuss, in a well-written paragraph, how you determined yout uniknown fatty. How did your measured results compare to the literature values of the possible unknown acids. Discuss any difficulties you encountered with the experiment. Discuss ary sources of error that may cause your results to be inaccurate. Totat /65pte You have 2 aftempts remaining
Step by Step Solution
There are 3 Steps involved in it

Get step-by-step solutions from verified subject matter experts