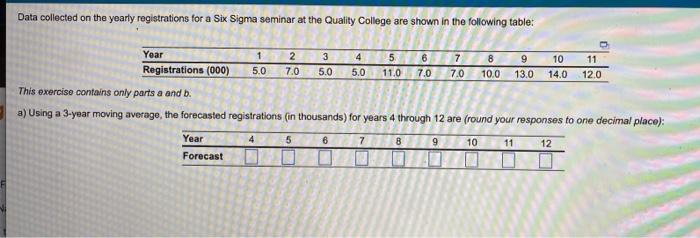
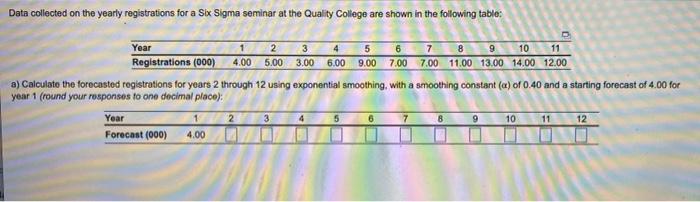
Question: Data collected on the yearly registrations for a Six Sigma seminar at the Quality College are shown in the following table: 5 8 1 5.0

Data collected on the yearly registrations for a
Data collected on the yearly registrations for a Six Sigma seminar at the Quality College are shown in the following table: 5 8 1 5.0 2 7.0 4 5.0 6 7.0 5.0 9 13.0 10 14.0 11 12.0 Year 3 7 Registrations (000) 11.0 7.0 10.0 This exercise contains only parts a and b. a) Using a 3-year moving average, the forecasted registrations (in thousands) for years 4 through 12 are (round your responses to one decimal place): Year 4 5 6 7 8 9 10 11 12 Forecast Data collected on the yearly registrations for a Six Sigma seminar at the Quality College are shown in the following table: 0 Year 1 2 3 4 5 6 7 8 9 10 11 Registrations (000) 4.00 5.00 3.00 6.00 9.00 7.00 7.00 11.00 13.00 14.00 12.00 a) Calculato the forecasted registrations for years 2 through 12 using exponential smoothing with a smoothing constant (a) of 0.40 and a starting forecast of 4.00 for year 1 (round your responses to one decimal place): Year 1 2 3 6 9 10 11 Forecast (000) 4.00

Step by Step Solution

There are 3 Steps involved in it

1 Expert Approved Answer
Step: 1 Unlock blur-text-image
Question Has Been Solved by an Expert!

Get step-by-step solutions from verified subject matter experts

Step: 2 Unlock
Step: 3 Unlock

Students Have Also Explored These Related General Management Questions!