

Question: DATA file ( a ) Discuss what does this scatter chart indicates about the relationship between profits and market capitalization? The scatter chart indicates that
DATA file
a Discuss what does this scatter chart indicates about the relationship between profits and market capitalization?
The scatter chart indicates that there may be a Select your answer hat linear relationship between profits and market capitalization.
b The data used to produce this are contained in the file Fortune Calculate the covariance between profits and market capitalization.
If required, round your answer to an integer. If your answer is negative use "minus sign".
Discuss what does the covariance indicates about the relationship between profits and market capitalization?
This indicates that there is a relationship between profits and market capitalization.
c Calculate the correlation coefficient between profits and market capitalization.
If required, round your answer to four decimal places. If your answer is negative use "minus sign".
What does the correlation coefficient indicate about the relationship between profits and market capitalization?
This indicates that there is a Select your answer hat between profits and market capitalization.
Icon Key
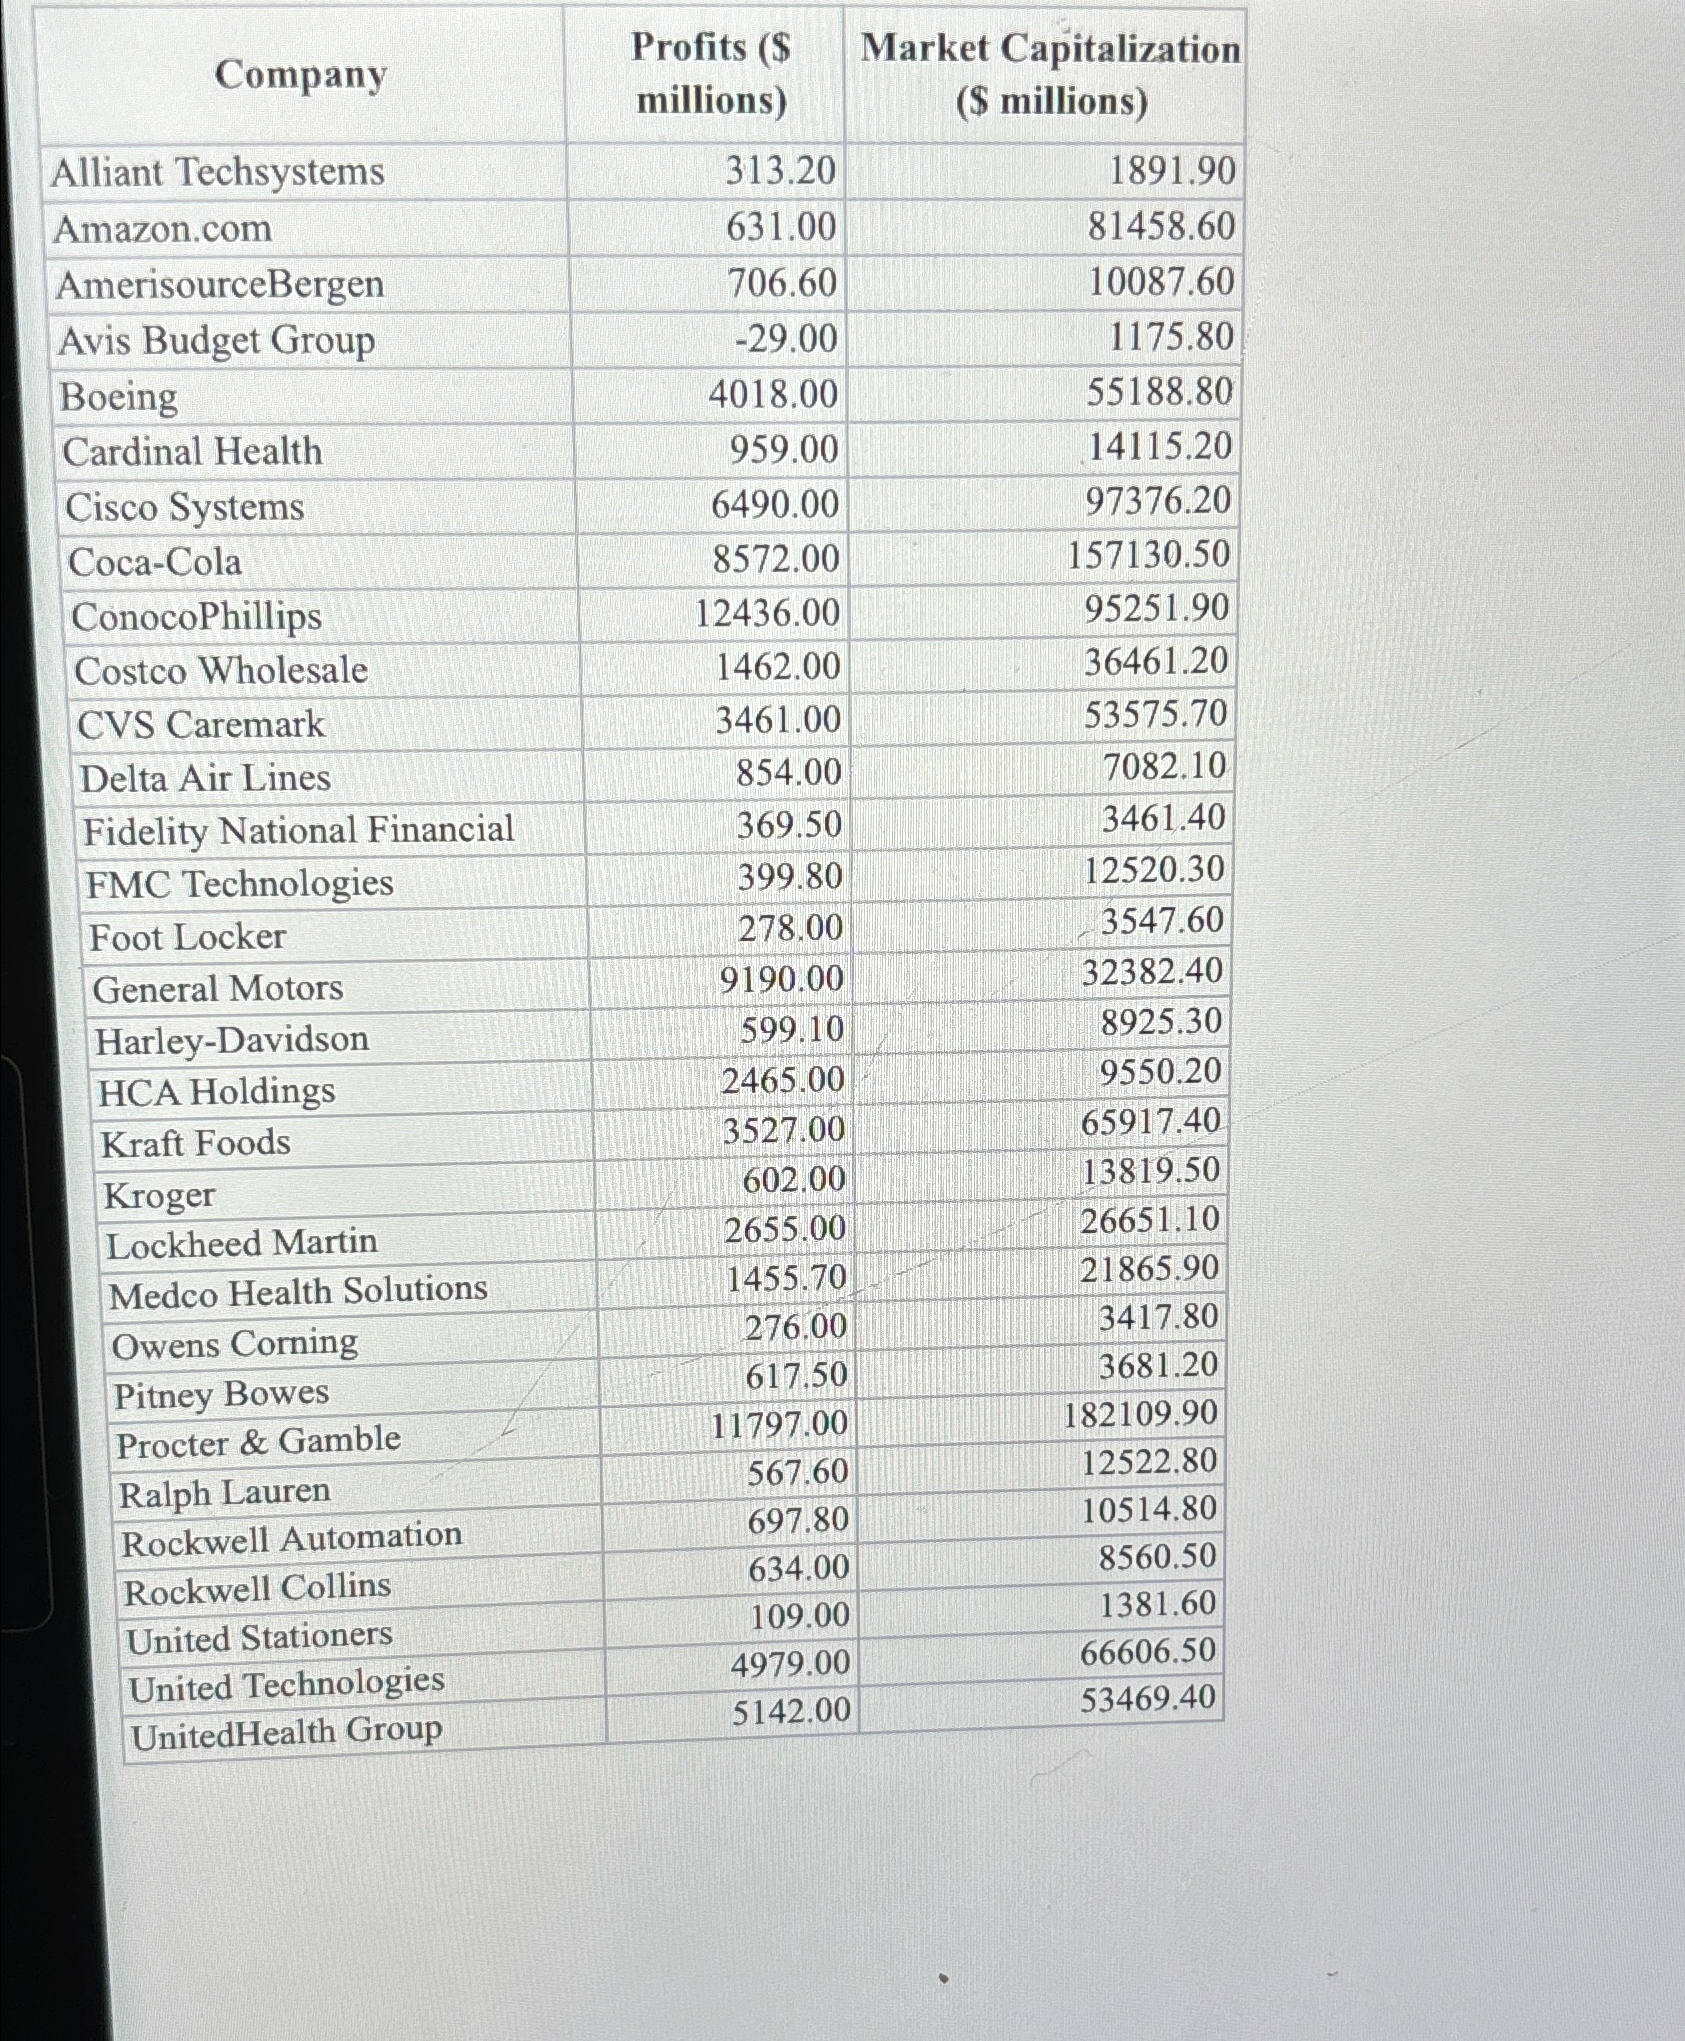
tableCompanytableProfits $millionstableMarket Capitalization$ millionsAlliant Techsystems,Amazoncom,AmerisourceBergenAvis Budget Group,BoeingCardinal Health,Cisco Systems,CocaCola,ConocoPhillipsCostco Wholesale,CVS Caremark,Delta Air Lines,Fidelity National Financial,FMC Technologies,Foot Locker,General Motors,HarleyDavidson,HCA Holdings,Kraft Foods,KrogerLockheed Martin,Medco Health Solutions,Owens Corning,Pitney Bowes,Procter & Gamble,Ralph Lauren,Rockwell Automation,Rockwell Collins,United Stationers,United Technologies,UnitedHealth Group,
Step by Step Solution
There are 3 Steps involved in it
1 Expert Approved Answer
Step: 1 Unlock

Question Has Been Solved by an Expert!
Get step-by-step solutions from verified subject matter experts
Step: 2 Unlock
Step: 3 Unlock