

Question: Data file: staffsurvey.sav Generate appropriate descriptive statistics to answer the following questions. (a) What percentage of the staff in this organisation are permanent employees? (Use
Data file: staffsurvey.sav
- Generate appropriate descriptive statistics to answer the following questions.
(a) What percentage of the staff in this organisation are permanent employees?
(Use the variable employstatus.)
(b) What is the average length of service for staff in the organisation? (Use the
variable service.)
(c) What percentage of permanent employees would recommend the organisation to others as a good place to work? (Use the variable recommend.)
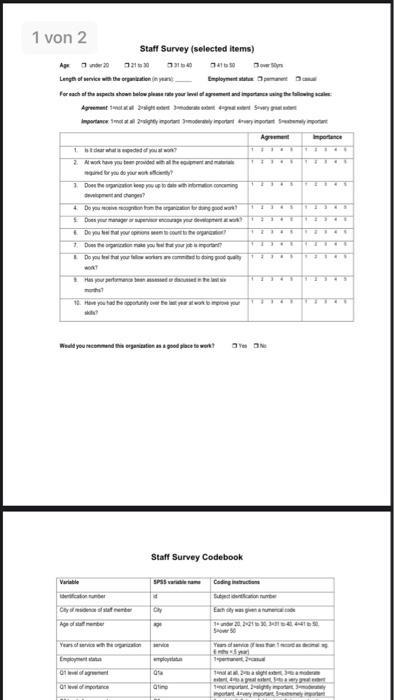
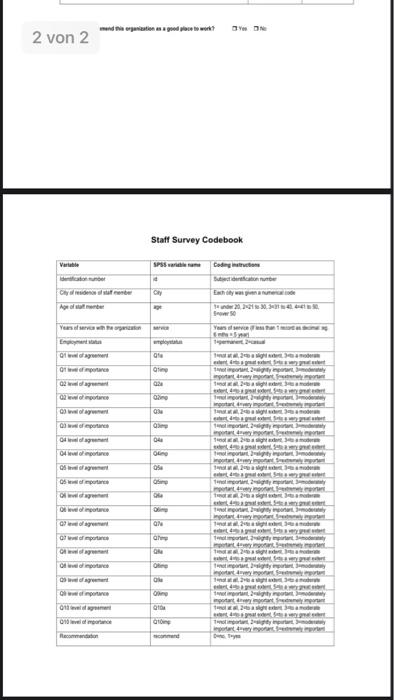
- Add up the total scores for a scale using the items that make up the Staff Satisfaction Survey. (Q1a,Q2a,Q3a,to Q10a), name the new variable totsatis
- First collapse the years of service variable (service) into three groups using the Visual Binning procedure from the transform menu and name the new variable servicegp3, then generate a bar graph to assess the staff satisfaction levels for permanent versus casual staff employed for less than or equal to 2 years, 3 to 5 years and 6 or more years. (The variables you will need are totsatis, employstatus and servicegp3)
- Generate a line graph to compare staff satisfaction for permanent and casual staff for different age groups.
- Check the reliability of the Staff Satisfaction Survey, which is made up of the agreement items in the data fie: Q1a to Q10a. None of the items of this scale needs to be reversed.
Step by Step Solution
There are 3 Steps involved in it
1 Expert Approved Answer
Step: 1 Unlock

Question Has Been Solved by an Expert!
Get step-by-step solutions from verified subject matter experts
Step: 2 Unlock
Step: 3 Unlock