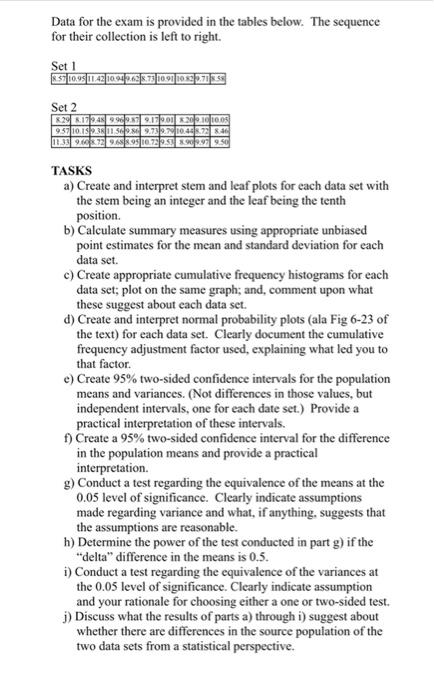
Question: Data for the exam is provided in the tables below. The sequence for their collection is left to right. Set 1 $5710,95 11.43 10.943436.7310911030.713 Set

Data for the exam is provided in the tables
Data for the exam is provided in the tables below. The sequence for their collection is left to right. Set 1 $5710,95 11.43 10.943436.7310911030.713 Set 2 8.17248 09:30 12:00 1.20 2.16 10.05 9.57 10.18 238 11 250 9.73 274 10:48 22 846 10.3390 29.6889510.79 5.909999.50 TASKS a) Create and interpret stem and leaf plots for each data set with the stem being an integer and the leaf being the tenth position b) Calculate summary measures using appropriate unbiased point estimates for the mean and standard deviation for each data set. c) Create appropriate cumulative frequency histograms for each data set; plot on the same graph; and, comment upon what these suggest about each data set. d) Create and interpret normal probability plots (ala Fig 6-23 of the text) for each data set. Clearly document the cumulative frequency adjustment factor used, explaining what led you to that factor. e) Create 95% two-sided confidence intervals for the population means and variances. (Not differences in those values, but independent intervals, one for each date set.) Provide a practical interpretation of these intervals. f) Create a 95% two-sided confidence interval for the difference in the population means and provide a practical interpretation. g) Conduct a test regarding the equivalence of the means at the 0.05 level of significance. Clearly indicate assumptions made regarding variance and what, if anything, suggests that the assumptions are reasonable. h) Determine the power of the test conducted in part g) if the delta" difference in the means is 0.5. i) Conduct a test regarding the equivalence of the variances at the 0.05 level of significance. Clearly indicate assumption and your rationale for choosing either a one or two-sided test. j) Discuss what the results of parts a) through i) suggest about whether there are differences in the source population of the two data sets from a statistical perspective

Step by Step Solution

There are 3 Steps involved in it

1 Expert Approved Answer
Step: 1 Unlock blur-text-image
Question Has Been Solved by an Expert!

Get step-by-step solutions from verified subject matter experts

Step: 2 Unlock
Step: 3 Unlock

Students Have Also Explored These Related General Management Questions!